
Figure 4.
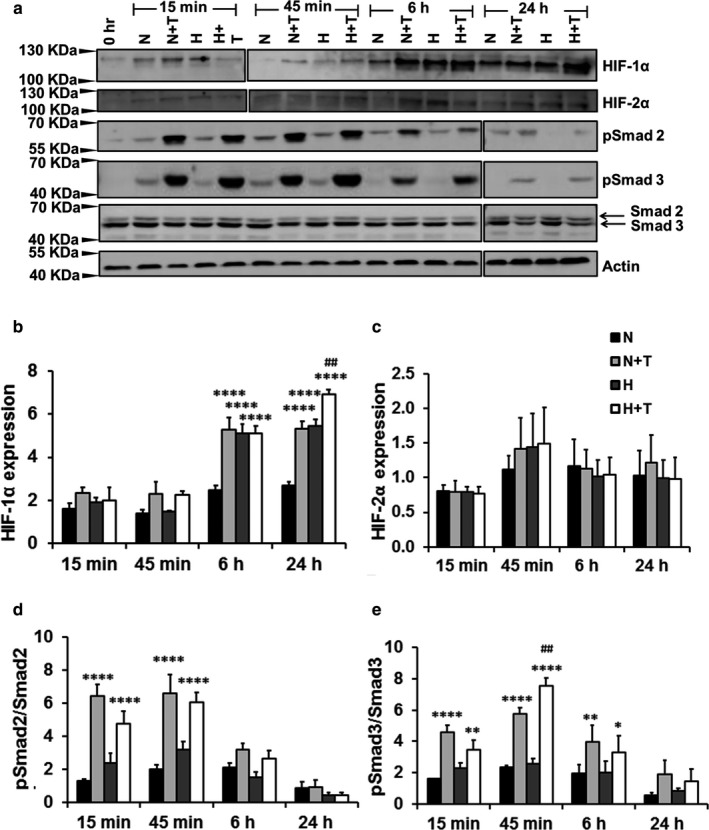
TGFβ1 induces the HIF‐1α expression. Western blots were performed in whole cell lysates of HPFs exposed to normoxia/hypoxia for 3 days, followed by treatment with TGFβ1 and/or hypoxia for 15 min to 24 hr. (a) Western blots. Due to a limited number of wells in SDS gels, two blots, as indicated by two separate borders, for each protein were generated by running two gels at the same time with the same conditions for transfer, antibody incubation and exposure. (b–e) Quantitation of protein expression. Quantification was performed using Image J software. The protein levels of HIF‐α (b) and HIF‐2α (c) were first normalized to β‐actin and then expressed as a ratio to 0 hr. pSmad2 (d) and pSamd3 (e) levels were represented as a ratio of pSmad2 or 3 to total Smad2 or 3. Values represent means ± SE. n = 3 independent experiments. Two‐way ANOVA and Fisher's LSD test was performed for statistical analysis. *p < .05, **p < .01, ****p < .0001 versus normoxia. ## p < .001 versus normoxia + TGFβ1. N: Normoxia (21% O2), T: TGFβ1 (5 ng/ml), H: Hypoxia (1% O2), H + T: hypoxia (1% O2) + TGFβ1 (5 ng/ml)