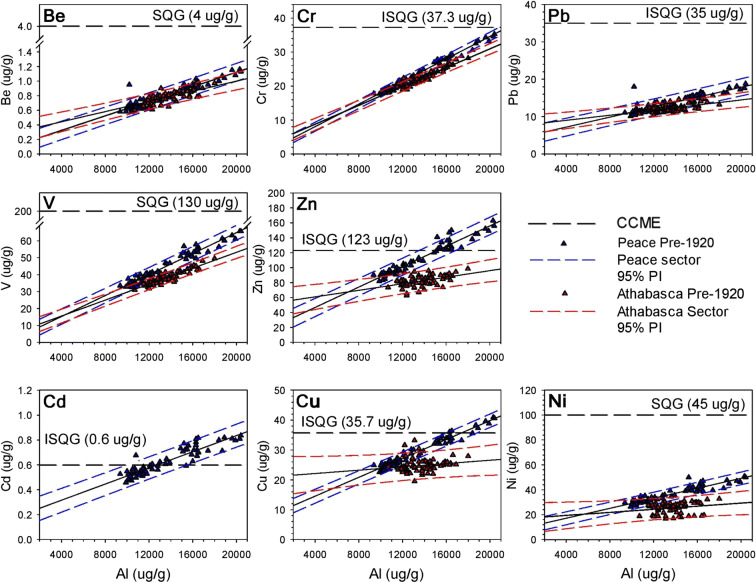
Fig. 3.
Cross-plots demonstrating the linear relations between pre-1920 metal concentrations and the normalizing agent (Al). The Peace River 95% PI (blue dashed lines) and regression lines are based on the pre-1920 measurements of metals from PAD 65 and PAD 67 (blue triangles). The Athabasca River 95% PI (red dashed lines) and regression lines are based on the pre-1920 measurements of metals concentrations from PAD 30, PAD 31, PAD 32, and M7 (red triangles). Canadian Council of Ministers of the Environment (CCME) (1999a, b, 2015a, b). Interim Sediment Quality Guidelines (ISQG) and Soil Quality Guidelines (SQG) plotted on y-axis denote the guideline concentrations for the metal of concern

