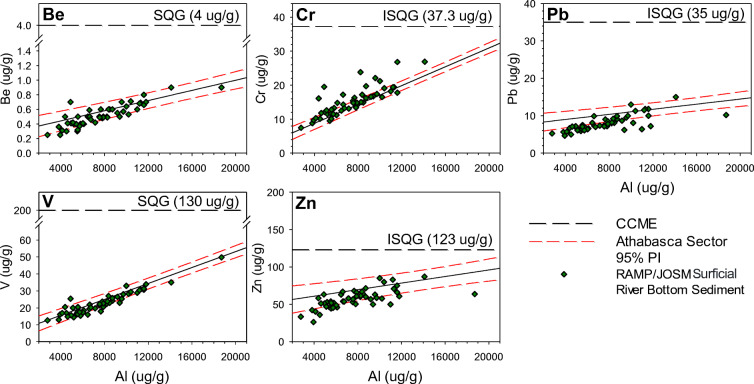
Fig. 6.
River-bottom sediment metals concentrations for samples collected by RAMP and OSM during 2000–2015 (RAMP 2019). Athabasca sector locations (ATR-ER, BPC-1, BPC-2, EMR-1, EMR-2, FLC-1, GIC-1) denoted by green diamonds plotted on the pre-1920 linear regressions and 95% PIs. Canadian Council of Ministers of the Environment (CCME) (1999a, b, 2015a, b) Interim Sediment Quality Guidelines (ISQG) and Soil Quality Guidelines (SQG) plotted on y-axis denoting the guideline concentrations for the metal of concern. Data are not shown for Cd, Cu, or Ni because pre-1920 relations with Al concentration are not statistically significant

