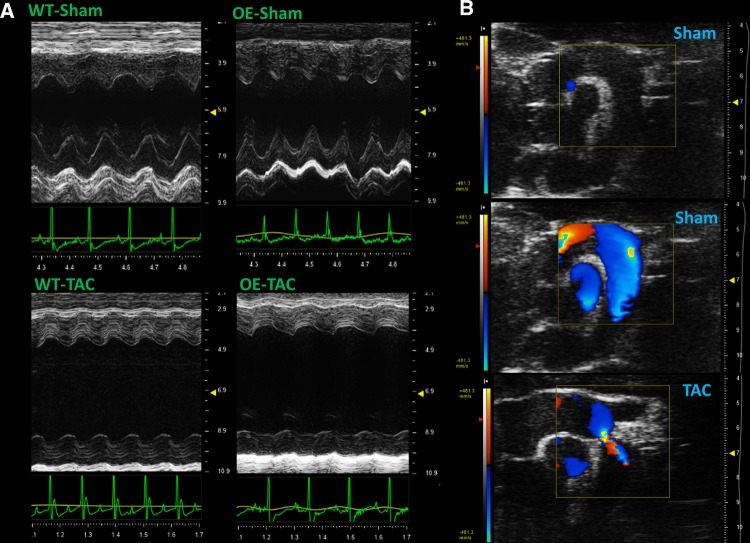
Fig. 2.
Representative echocardiograms obtained 6 weeks after transverse aortic constriction (TAC) or sham surgery. a Shows M-mode images from the parasternal short-axis view from all four experimental groups, representing wild-type (WT) and Mt-CK overexpressing mice (OE). b Shows sagittal views through the aortic arch with the aortic root in the upper left of each image. The upper and middle images are from a sham-operated mouse shown with and without colour Doppler for anatomical reference. The lower image illustrates the severe aortic stenosis that was observed in all TAC operated mice

