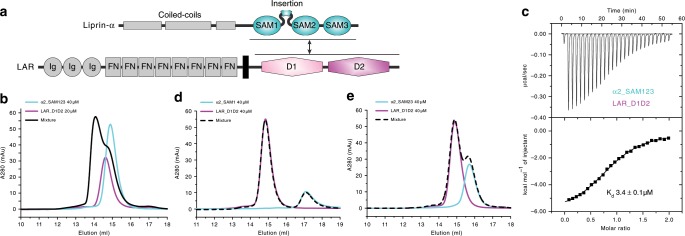
Fig. 1. Biochemical characterization of the liprin-α and LAR-RPTP interaction.
a Cartoon diagrams of domain organizations of liprin-α and LAR. The color-coding of the regions is applied throughout the entire manuscript except as otherwise indicated. b, d, e Analytical gel filtration analysis showing the interaction with LAR requires all three SAM domains of liprin-α. c Isothermal titration calorimetry (ITC)-based measurement of the binding of α2_SAM123 to LAR_D1D2.

