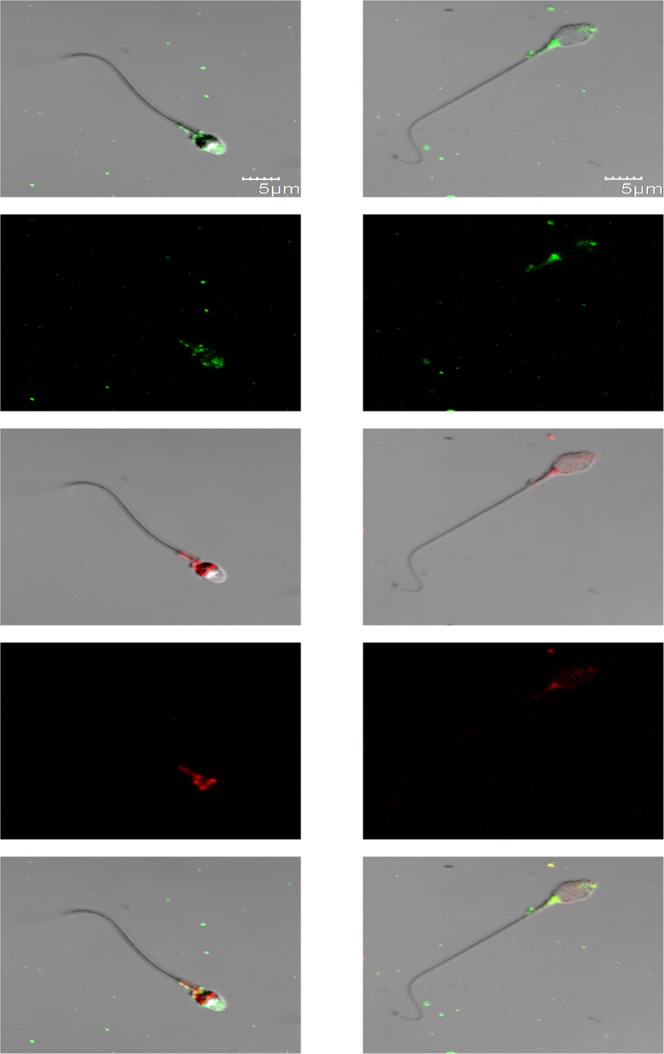
Figure 1.

Representative confocal images (average of four Z projected slices) showing the locations of rhodopsin and melanopsin in two human sperm cells, revealed by immunocytochemical analysis. Rhodopsin and melanopsin are stained in green and red, respectively. See Methods for the antibodies used. Each column shows one of the cells at the following five configurations (from top to bottom): rhodopsin staining overlaid with the DIC image of the cell, rhodopsin staining, melanopsin staining overlaid with the DIC image of the cell, melanopsin staining, and both rhodopsin and melanopsin staining overlaid with the DIC image of the cell.
