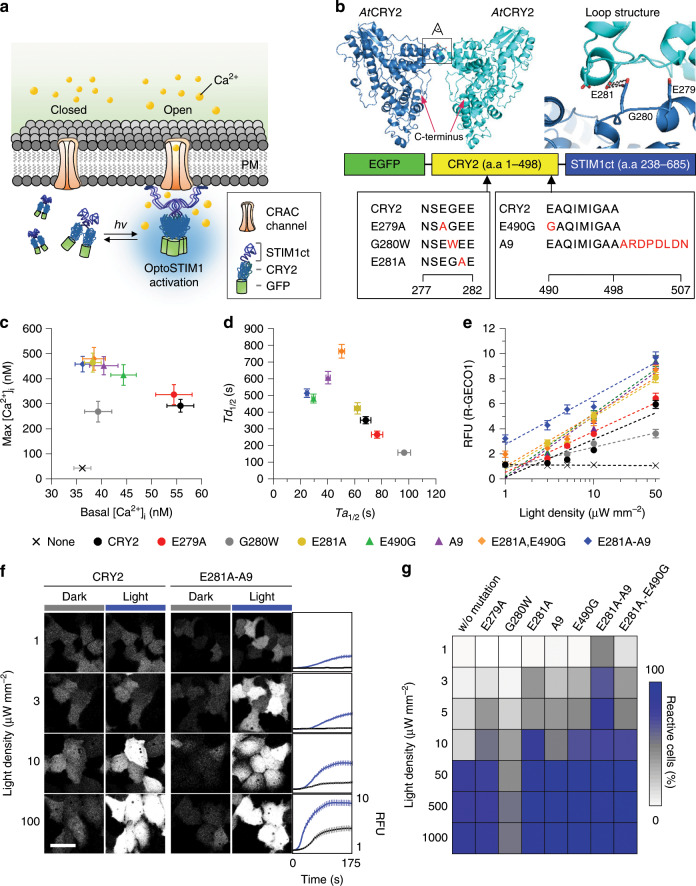
Fig. 1. Development of ultra-light-sensitive OptoSTIM1.
a Schematic representation of working mechanism of the OptoSTIM1. PM, plasma membrane; STIM1ct, C-terminal fragment of STIM1 (a.a 238−685). b Model structure of AtCRY2 predicted by SWISS-MODEL. Expanded view on the right represents loop structure in the potential dimeric interface highlighted in black box on the crystal structure; amino acids for the target region for mutagenesis are aligned. Reds indicate specific residues mutagenized. c Graph showing correlation between [Ca2+]i in dark (x axis) and [Ca2+]i upon light stimulation (y axis) measured using Fura-2. d Plot representing correlation between half-maximal time point for reaching saturated R-GECO1 level upon light stimulation (x axis) and basal R-GECO1 level in dark (y axis) for each indicated variant (n ≥ 100 for each variant). e Graph showing maximal R-GECO1 fluorescence intensity based on varying light density (1−50 μW mm−2). Blue light was delivered at each indicated power density at 5-second intervals for 1 minute using a 488 nm laser (n ≥ 100 for each variant at each light density). f Representative R-GECO1 images of cells expressing either OptoSTIM1(CRY2) or OptoSTIM1(CRY2E281A-A9) (488 nm, 1−100 μW mm−2, 5-second intervals for 1 minute). Graphs on the right indicate fluorescence change of R-GECO1 upon light stimulation (Black, CRY2; Blue, CRY2E281A-A9). Scale bar, 10 μm. g Heat plot showing extent of reactive cell population upon light stimulation with each indicated light density. Images and quantified data are representative of multiple experiments (n > 3). Data represent means ± s.e.m.

