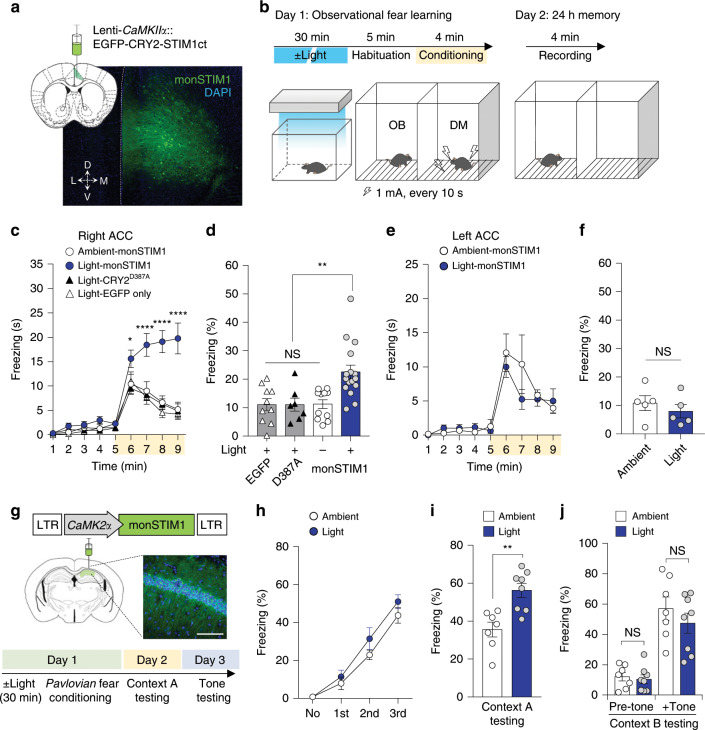
Fig. 3. Effects of non-invasive optical Ca2+ modulation on specific mice behaviors.
a Image showing representative histology sample of right ACC expressing monSTIM1. b Schematic depiction of observational fear learning paradigm. OB, observer mouse. DM, demonstrator mouse. c Summary data showing average time for freezing. Yellow box indicates the time window for foot-shock administration. (*P < 0.05, ****P < 0.0001; P value was determined by one-way ANOVA). d Graph describing the percentage of time spent freezing during the 24-hour memory test (**P < 0.01, NS = Not significant; Tukey’s tests). e Graph showing average time for freezing with mice expressing monSTIM1 at left ACC on acquisition of observational fear (Day 1). f Graph indicating the percentage of time spent freezing during 24-hour memory test (NS = Not significant; Student two-tailed t test). g Image showing fluorescence image of histology of right CA1 hippocampus (Blue, DAPI; Green, OptoSTIM1; Scale bar, 50 μm) with schematic depiction of conducted fear conditioning experiment. h–j Graphs showing the percentage of freezing behavior of mice at each training points during fear conditioning h, at 24-hour contextual memory test i, and at 48-hour post training with tone memory test j. (**P = 0.002 for light-illuminated versus ambient; NS = Not significant by Student’s two-tailed t test. Images and quantified data are representative of multiple experiments (n > 3). Data represent means ± s.e.m.

