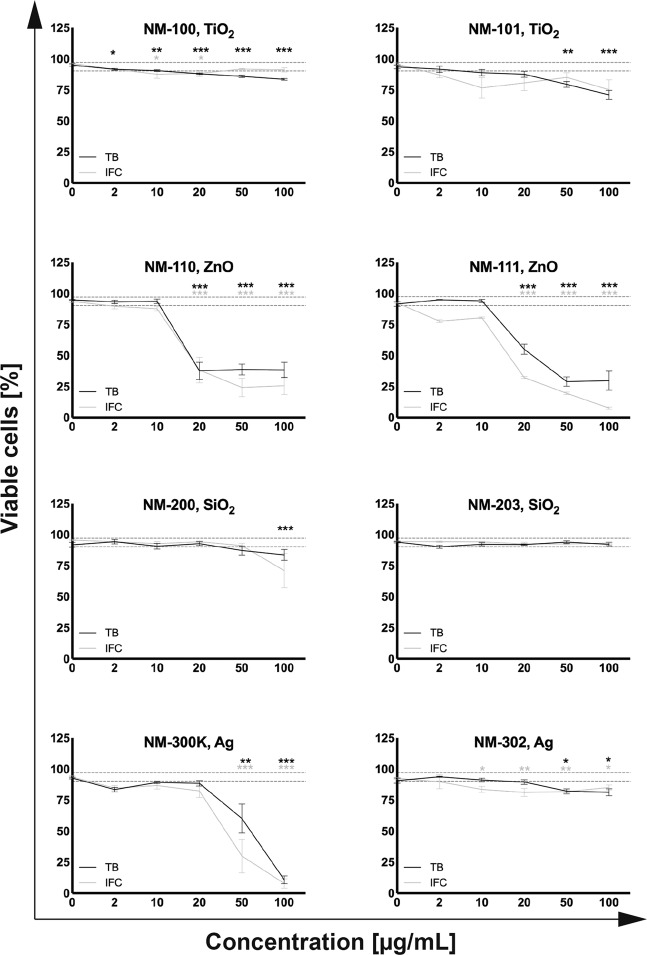
Figure 10.
Dose-response curves: TB and IFC assays. The dotted grey line represents the mean ± SE of viable cells for all negative controls (TB and IFC) in percentages of the total count. We defined this as the “healthy cells” area. A toxic effect was judged statistically significant in comparison to the control (0 μg/mL) based on a one-way ANOVA test (*P ≤ 0.05, **P ≤ 0.01, and ***P ≤ 0.001) for n ≥ 3 individual repeats in duplicate.

