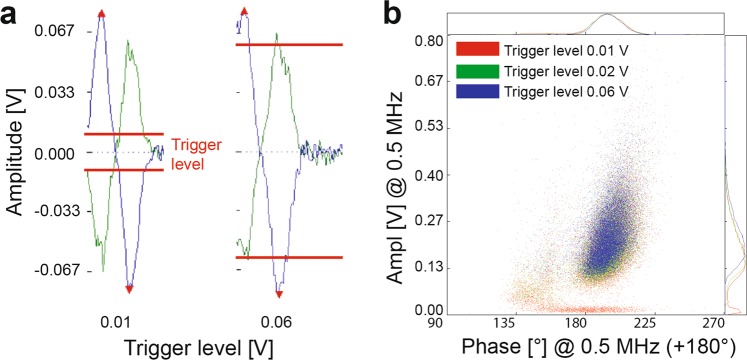
Figure 7.
IFC measurements using different trigger levels. (a) The impedance signal at low trigger levels (0.01 V) is higher than the set threshold and the signal will be considered as a cell/particle, but can include measurement signals from the cell debris and electrical noise. Higher trigger levels (0.06 V) will exclude erroneous background signals, however smaller cells/particles might be lost due to the high threshold. (b) Density scatter plot using trigger levels of 0.01, 0.02, and 0.06 V. A low trigger level (0.01 V, red) includes signal from debris as seen as distinct population at low amplitude. This is avoided with higher trigger levels such as 0.02 V and 0.06 V. However, too high trigger levels, here > 0.06 V, might exclude cells/particles.

