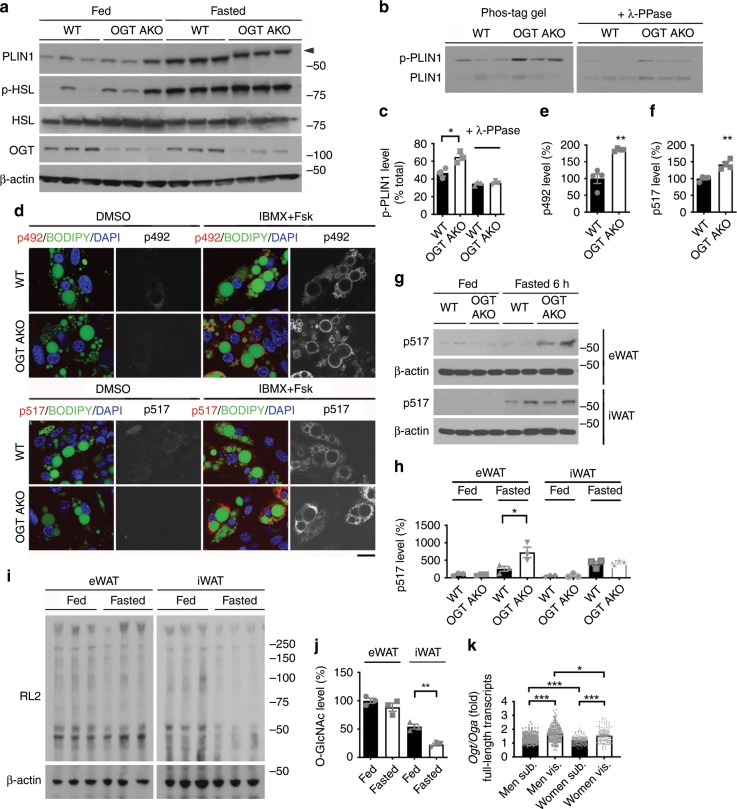
Fig. 4. Loss of OGT promotes fasting-induced PLIN1 phosphorylation in visceral fat.
a Western blot analysis of PLIN1, p-HSL, HSL, OGT, and β-actin in eWAT of fed and 6 h fasted WT and OGT AKO mice (three experiments). b, c Phos-tag gel analysis and quantification of PLIN1 in eWAT of fed and 6 h fasted WT and OGT AKO mice; λ-PPase was used to remove phosphate groups from phosphorylated serine, threonine, and tyrosine residues (n = 3/group for c, three experiments). d–f Immunofluorescence staining and quantification of PLIN1 phosphorylation at serine 492 (p492) and serine 517 (p517) in primary adipocytes differentiated in vitro from the WT and OGT AKO eWAT SVFs (n = 4/group, three experiments); IBMX and forskolin (Fsk) were used to stimulate cAMP/PKA pathway; lipid droplets were stained with BODIPY 493/503 (green) and nuclei were stained with DAPI (blue), scale bar is 20 μm. g, h Representative Western blots and quantification of PLIN1 phosphorylation at serine 517 (p517) in eWAT and iWAT of fed and 6 h fasted WT and OGT AKO mice (n = 3/group for h, three experiments). i, j Western blot analysis and quantification of overall O-GlcNAcylation levels in eWAT and iWAT of fed and 6 h fasted WT and OGT AKO mice; RL2 recognizes O-GlcNAc modification on proteins (n = 3/group, three experiments). k Ratios of Ogt/Oga mRNA levels (full-length transcripts) in human subcutaneous fat (Sub.) and visceral fat (Vis.); original raw data was from the Genotype-Tissue Expression (GTEx) database (n > 100/group). Data are presented as mean ± s.e.m. Statistical analysis: ANOVA with Dunnett’s multiple comparisons for k and Student’s t test for the rest, *p < 0.05, **p < 0.01, and ***p < 0.001. Source data are provided as a Source Data file.

