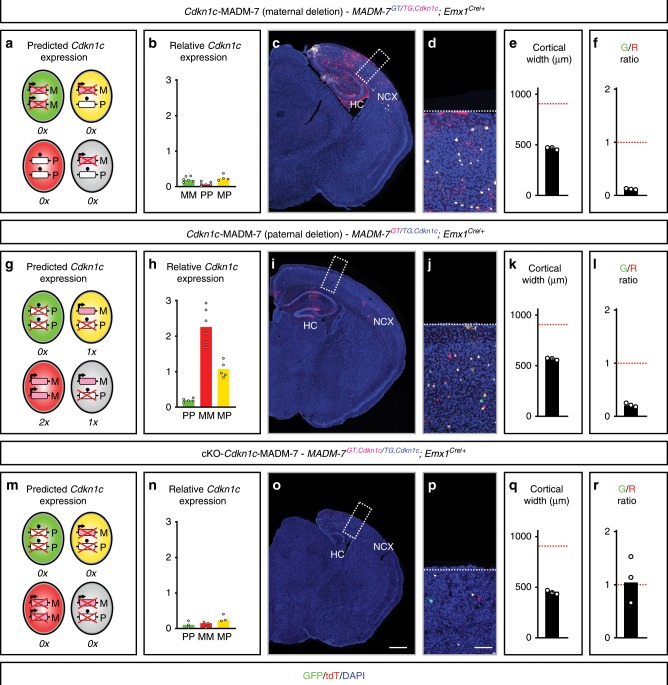
Fig. 3. Cell-autonomous growth-promoting Cdkn1c function is independent of genomic imprinting status.
Analysis of Cdkn1c-MADM-7 (MADM-7GT/TG,Cdkn1c;Emx1Cre/+) with maternal deletion (a–f), Cdkn1c-MADM-7 (MADM-7GT/TG,Cdkn1c;Emx1Cre/+) with paternal deletion (g–l), and cKO-Cdkn1c-MADM-7 (MADM-7GT,Cdkn1c/TG,Cdkn1c;Emx1Cre/+) (m–r). The parent from which the MADM cassettes with or without recombined Cdkn1c-flox allele (Cdkn1c) were inherited is indicated in the respective genotypes in pink (mother) and blue (father). Predicted Cdkn1c expression in GFP+ (green), tdT+ (red), GFP+/tdT+ (yellow) and unlabeled (gray) MADM-labeled cells (a, g, m); and true relative levels of Cdkn1c expression in GFP+ (green bar), tdT+, (red bar), GFP+/tdT+ (yellow bar) MADM-labeled cells (b, h, n) in Cdkn1c-MADM-7 with maternal deletion (a, b), Cdkn1c-MADM-7 with paternal deletion (g, h), and cKO-Cdkn1c-MADM-7 (m, n) at E16 are indicated (MM, matUPD; PP, patUPD; MP, control). Data points indicate individual animals (n = 5–7).Outlier values are not shown (see Source Data File). Bars indicate median. Imprinting of Cdkn1c (arrow, expression; ball on stick, repression) and predicted expression (0×, 1×, 2×) is indicated. Parental origin of chromosome is indicated (M, maternal; P, paternal) and conditional deletion of Cdkn1c is marked with red cross. MADM-labeling (GFP+, green; tdT+, red; GFP+/tdT+, yellow) (c, d, i, j, o, p), cortical width (μm) is shown with an error bar representing SEM (e, k, q), and G/R ratio (geometric mean) of single MADM-labeled cortical projection neurons (f, l, r) in Cdkn1c-MADM-7 with maternal deletion (c–f), Cdkn1c-MADM-7 with paternal deletion (i–l), and cKO-Cdkn1c-MADM-7 (o–r) at P21 are indicated. Boxed areas in overview images (c, i, o) show representative images of the extent of microcephaly at higher resolution (d, j, p). Nuclei were stained using DAPI (blue). Scale bar, 500 μm (overview (c, i, o)) and 90 μm (inset (d, j, p)). Note the decreased numbers of Cdkn1c−/− cells when compared to Cdkn1c+/+ cells in (f) and (l) but equipotency/equal numbers of Cdkn1c−/− cells in (r) regardless of the UPD status. Data points (e, f, k, l, q, r) indicating individual animals (n = 3). NCX neocortex, HC hippocampus. Source data are provided as a Source Data file.

