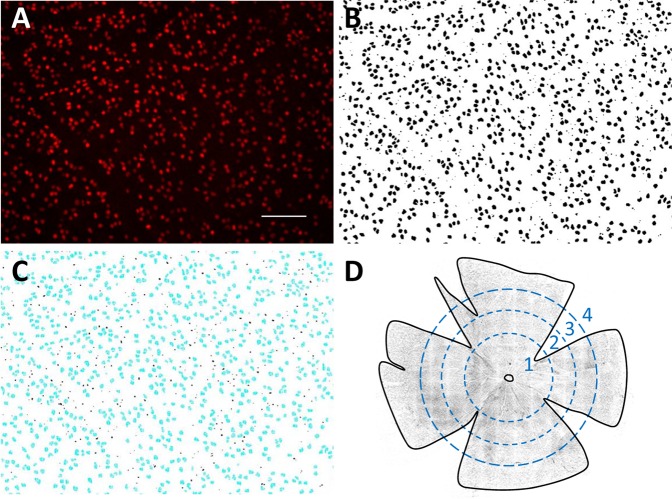
Figure 4.
Counting retinal ganglion cells. (A) Raw image of Brn3a-labelled cells in a healthy rat retina. The image is a maximum-intensity projection of a stack of images collected along the z (depth) axis. Scale bar is 100 μm. (B) Image after applying a custom filter sequence and binary threshold to highlight labeled cells and a watershed function to separate overlapped cells. (C) Cells that were counted (blue) in the image using a size constraint of 15 to 300 µm2. (D) Image of a flat-mounted rat retina. Dashed circles subdivide the tissue into: (1) central, (2) inner peripheral, (3) mid peripheral, and (4) outer peripheral regions within which cell counts were tabulated. Circle radii correspond to 1.9, 2.8, and 3.7 mm in retinal space. Solid line outlines the tissue border for purpose of area measurement and cell density calculation.

