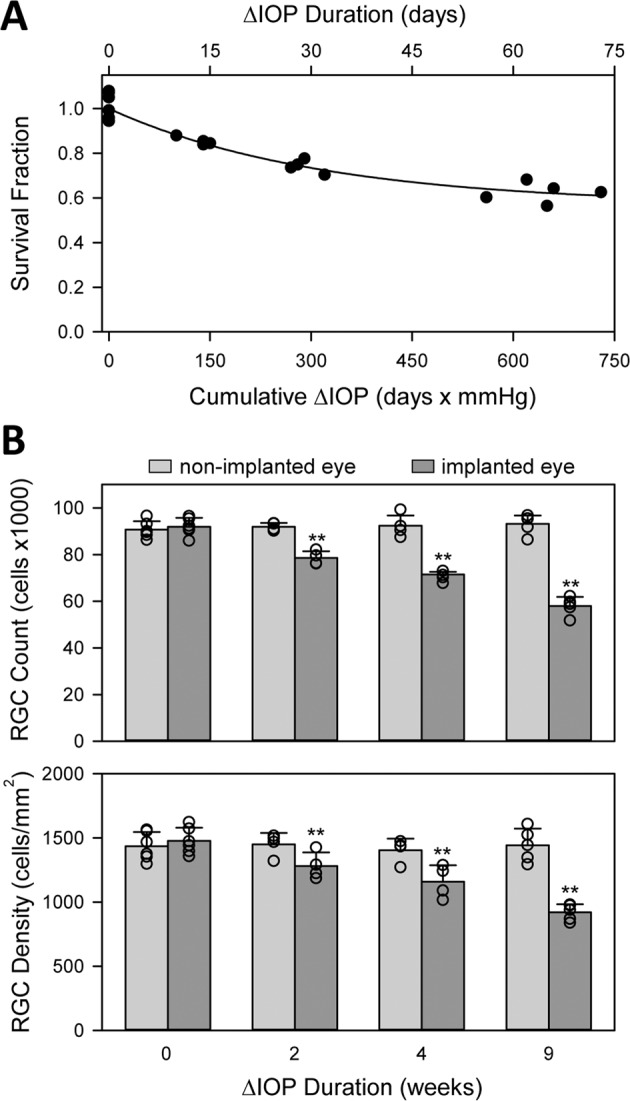
Figure 5.

IOP-induced loss of RGCs. (A) Fraction of surviving cells as a function of the duration of IOP elevation and cumulative IOP insult. Survival fraction (SF) was defined as the ratio of RGC counts in the implanted and non-implanted eyes. Points at 0 days are control animals in which a cannula was implanted for several weeks but IOP was not elevated. Solid line is a regression of the data to the equation: . (B) Average RGC count (top) and density (bottom) in non-implanted and implanted eyes exposed to 0 weeks (controls) and approximately 2, 4, and 9 weeks of IOP elevation. Symbols give individual eye data. Error bars are standard deviations. Asterisks indicate statistically significant differences.
