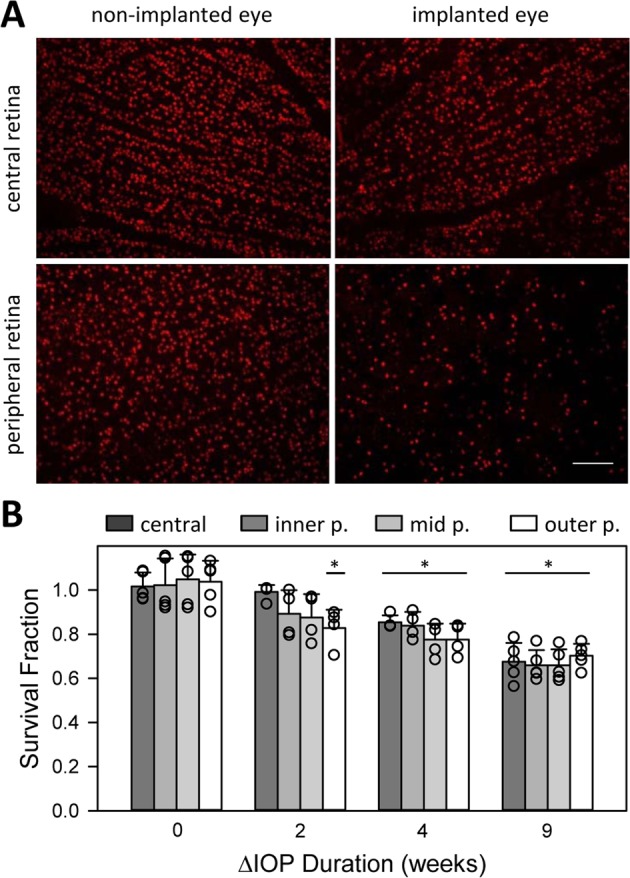
Figure 6.

Regional variation in RGC loss. (A) Images of Brn3a-positive nuclei in the central (top) and peripheral (bottom) retina of the non-implanted (left) and implanted (right) eyes of an animal after 63 days of IOP elevation. Scale bar is 100 μm (B) Survival fraction of RGCs within central, inner peripheral, mid peripheral, and outer peripheral regions of the retina of animals exposed to 0 weeks (controls) and approximately 2, 4, and 9 weeks of IOP elevation. SF was computed for each region from the ratio of cell densities in the implanted and non-implanted eye. Symbols give individual eye data. Error bars give standard deviation. Asterisks indicate statistical differences from control animals.
