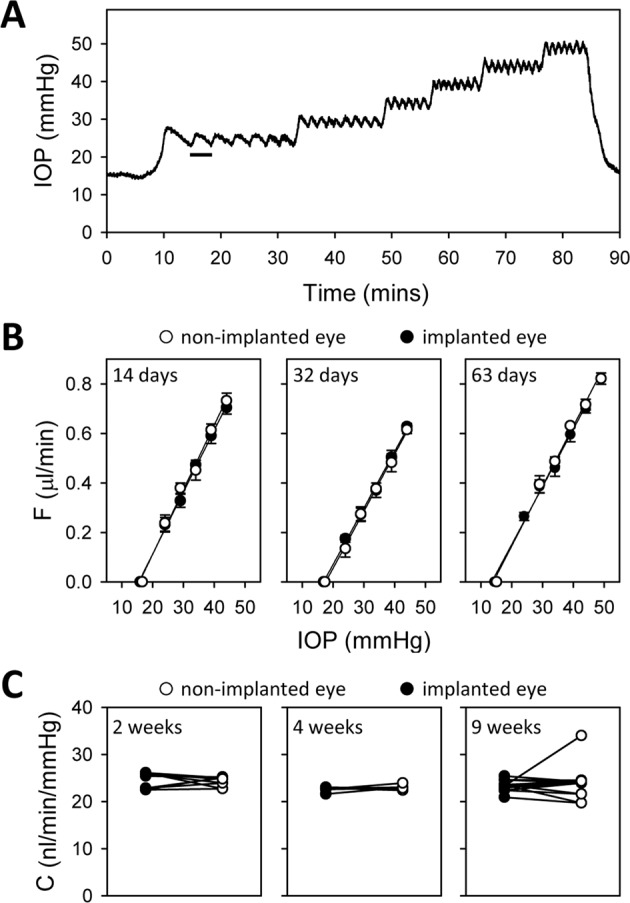
Figure 8.

Aqueous humor dynamics of IOP-elevated eyes. (A) IOP record of implanted eye of an anesthetized animal during outflow facility measurement. The bar indicates one duty cycle of the pump, which turned on and off to hold IOP at different levels above the resting IOP (15 mmHg). (B) Fluid outflow rate (F) at different IOP set points for the implanted (filled symbols) and non-implanted (unfilled symbols) eyes of animals exposed to 2 weeks (left), 4 weeks (middle), and 9 weeks (right) of IOP elevation. F was determined from measured duty cycles in A. Lines are regression fits to estimate the data slope, which determines conventional outflow facility (C). C, Measured C for the implanted and non-implanted eye of all animals in each exposure group.
