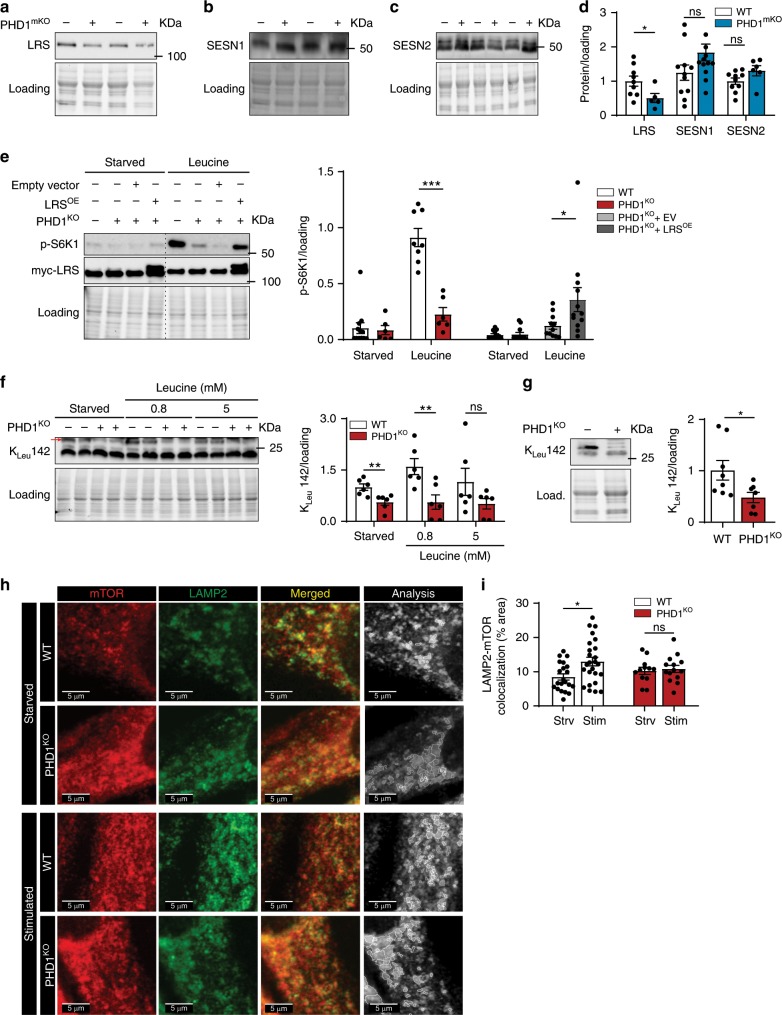
Fig. 4. PHD1 controls intracellular leucine sensing through leucyl tRNA synthetase.
a–c Representative pictures and quantification (d) of western blot analysis of LRS, SESN1, and SESN2 protein levels in TA muscles from WT (white bars) and PHD1mKO male and female (blue bars) mice. e PHD1KO myogenic progenitors were transduced with lentiviruses to over-express myc-LRS (LRSOE), an empty vector (EV) was used as control. Representative pictures (left panel) and quantification (right panel) of western blot analysis of S6K1 phosphorylation and myc-LRS expression levels in differentiated WT (white bars), PHD1KO (red bars), PHD1KO + EV (light gray bars) and PHD1KO + LRSOE myotubes (dark gray bars) after 1 h starvation (starved) or 30 min stimulation with 5 mM leucine (leucine). f Representative picture (left panel) and quantification (right panel) of western blot analysis of RagA leucylation (KLeu142) levels in WT (white bars) and PHD1KO (red bars) myotubes after 1 h starvation (starved) or 30 min stimulation with different doses of leucine (leucine). g Representative picture (left panel) and quantification (right panel) of western blot analysis of RagA leucylation (KLeu142) levels in TA from WT (white bars) and PHD1KO (red bars) female mice. Representative pictures (h) and quantification (i) of colocalization between mTOR (red) and LAMP2 (green) in WT (white bars) and PHD1KO (red bars) myotubes. Merged (gray) picture shows the outline of the colocalization analysis between mTOR and LAMP2 that was performed to generate data shown in panel (i). Dots represent quantification of individual myotubes from three independent experiments. Statistics: two-way ANOVA test with a Holm–Sidak post hoc test (e, i) or unpaired t test (d, f, g) (*p < 0.05; **p < 0.01; ***p < 0.001; ns not significant). Each dot represents a single mouse. Dots represent experimental duplicates from four independent experiments (e, f). Bar graphs represent mean ± SEM (error bars). Data is presented as fold change to WT starved (e, f) or fold change to WT (d, g). See also Supplementary Fig. 4. Source data are provided as a Source Data file.

