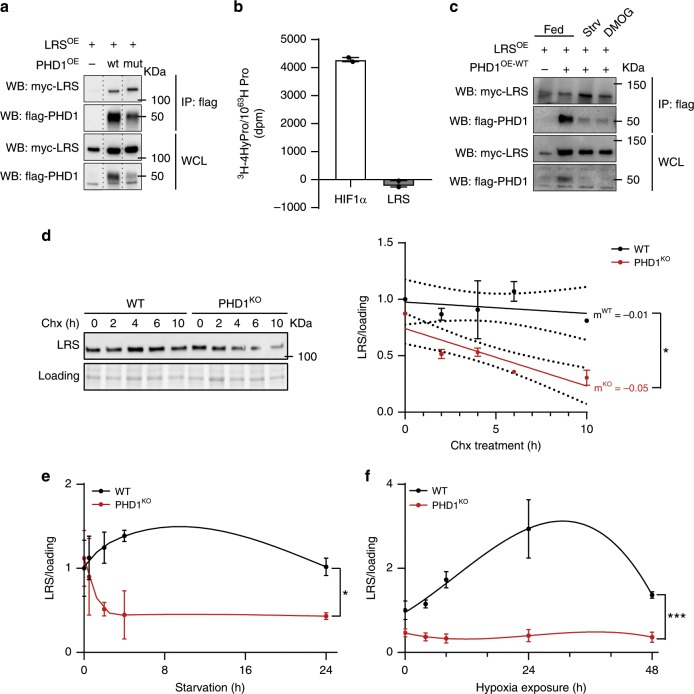
Fig. 5. PHD1 interacts with LRS and controls LRS stability.
a HEK293T cells were transfected with myc-LRS, myc-LRS and flag-PHD1WT or myc-LRS and flag-PHD1MUT. Cell lysates were immunoprecipitated with anti-flag antibody. Co-precipitation of myc-LRS was determined by western blot analysis using an anti-myc antibody. The figure shows a representative experiment. b In vitro hydroxylation assay using 3H-labeled in vitro translated LRS (gray bar) or HIF1α (white bar; positive control) in the presence of affinity purified PHD1. c HEK293T cells were transfected with myc-LRS or myc-LRS and flag-PHD1WT and treated with DMOG or amino acid starved for 4 h. Cell lysates were immunoprecipitated with anti-flag antibody. Co-precipitation of myc-LRS was determined by western blot analysis using an anti-myc antibody. The figure shows a representative experiment. d Representative picture (left panel) and quantification (right panel) of western blot analysis of LRS protein levels in WT (black line) and PHD1KO (red line) myotubes exposed to cycloheximide (Chx) for different amounts of time. Dots represent the mean from 2 independent experiments. e Time-course analysis of LRS protein levels in WT (black line) and PHD1KO (red line) myotubes exposed to amino acid starvation. Dots represent the mean from three independent experiments. f Time-course analysis of LRS protein levels in WT (black line) and PHD1KO (red line) myotubes exposed to hypoxia (1% oxygen). Dots represent the mean from 3 independent experiments. Statistics: two-way ANOVA (in e and f, interaction effects are indicated) with a a t test (d) (*p < 0.05; **p < 0.01; ***p < 0.001; ns not significant). Bar graphs and line graphs represent mean ± SEM (error bars). Data are presented as fold change to WT 0 h (d, e, f). See also Supplementary Fig. 5. Source data are provided as a Source Data file.

