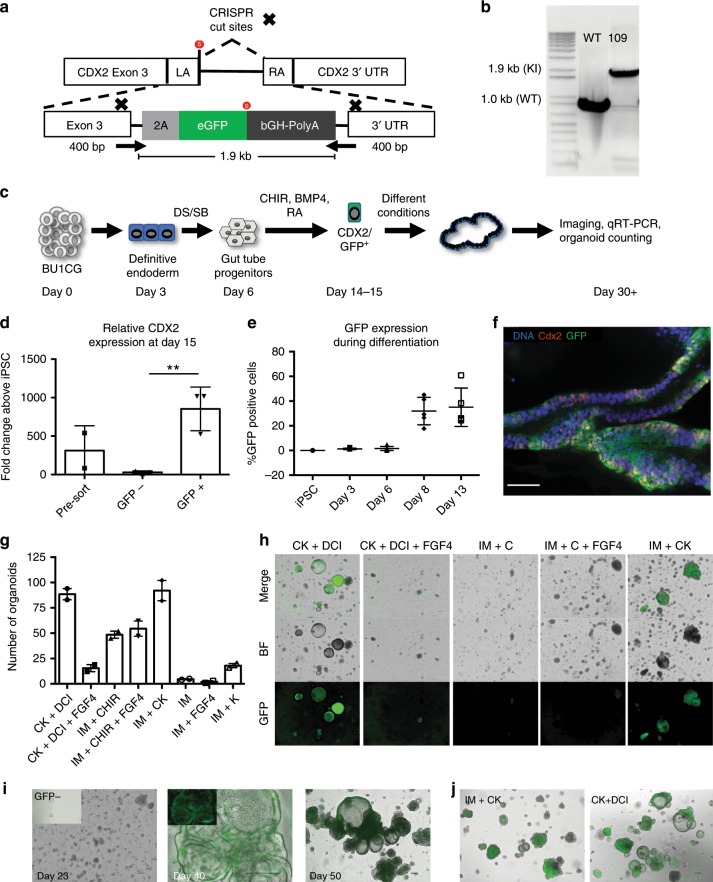
Fig. 4. A CDX2-GFP iPSC reporter line for intestinal differentiation.
a Detailed schematic of the reporter construct and PCR screening primer sites (arrows). b Positive PCR screening of mono-allelic (17) and bi-allelic (109) knock-in clones derived from iPSC line bBU1c2. c Experimental schematic of differentiation of BU1CG into HIOs. d qRT-PCR for CDX2 expression in cells at day 15 of differentiation comparing sorted GFP+ to both GFP− sorted cells as well as pre-sort (2−ΔΔCT technical triplicates normalized to GAPDH, n = 3 independent sorts, error bars represent the s.d., p = 0.007, **p < 0.01) as determined by unpaired Student’s t-test). e FACS analysis of GFP expression during the first two weeks of differentiation (n = 4 independent differentiations, error bars represent the s.d.). f Quantification of number of organoids per independent well obtained at day 50 of differentiation (error bars indicate s.e.m. from n = 2 independent wells per condition). g Whole mount immunofluorescence of HIOs at D40 of differentiation stained for Cdx2, GFP, and DNA (blue) (scale bar = 50 μm, representative of n = 6 organoids from n = 2 differentiations). h Representative micrographs of HIOs at day 34 of differentiation using different media conditions (originally sorted at day 14 for CDX2GFP, scale bar = 100 μm, representative fields of view of n = 2 wells per condition). i Representative micrographs showing the formation of HIOs from BU1CG after sorting GFP + cells at day 14 (scale bar = 200 μm). Inset shows limited outgrowth from GFP− sorted cells cultured in the same media conditions (IM + CK) (scale bar = 200 μm) (representative of n = 3 differentiations). j Representative micrographs showing HIOs at day 45 comparing CK + DCI vs IM + CK conditions (scale bar = 200 μm, representative of n = 6 differentiations).

