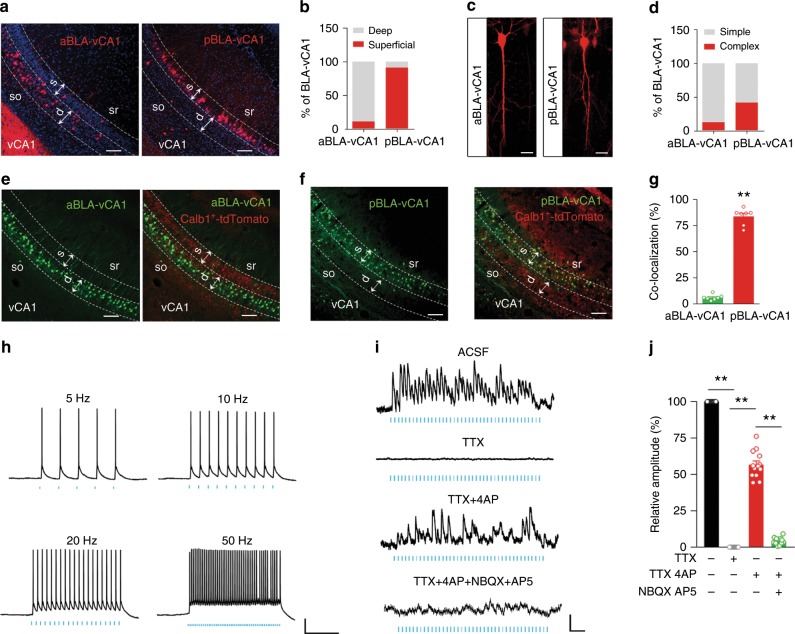
Fig. 1. Features of a/pBLA-innervated vCA1 neurons along the superficial-deep axis.
Representative images (a) and quantification (b) show the predominance of aBLA-innervated neurons in the deep layer of vCA1 (left) and pBLA-innervated neurons in the superficial layer (right). By anterograde monosynaptic tracing, vCA1 neurons receiving monosynaptic inputs from aBLA and pBLA were labelled by tdTomato. aBLA anterior BLA, pBLA posterior BLA. Scale bar, 100 μm; n = 4 mice per group. Representative images (c) and quantification (d) show simple (c, left) and complex (c, right) vCA1 neurons innervated by aBLA and pBLA. Scale bar, 30 μm; n = 5 mice per group. e–g Distinct distributions of calbindin1-positive neurons (Calb1+) in aBLA- and pBLA-innervated vCA1 neurons. By anterograde multisynaptic tracing (H129-G4), pBLA-innervated vCA1 neurons (GFP) were predominately colocalized with Calb1+ (tdTomato) (f, g), while low colocalization was shown in aBLA-innervated vCA1 neurons (e, g). Scale bar, 100 μm; n = 7 mice per group. Unpaired t test, t = 24.76 df = 7.266, P < 0.0001. h Action potential firing of a pBLA neuron in response to patterned blue laser light (472 nm, 5/10/20/50 Hz, 5 ms pulses) recorded by ex vivo current-clamp recording. Scale bar, 20 mv and 500 ms. i, j Subthreshold responses of vCA1 neurons to the photoactivation of pBLA–vCA1 inputs, 20 Hz, 5 ms pulses in ACSF (top) with TTX, TTX + 4AP or TTX + 4AP + AP5 + NBQX (GluR antagonist). Scale bar, 2 mv and 200 ms (i). Amplitude changes in EPSPs after TTX, TTX + 4AP or GluR antagonist perfusion (one-way ANOVA, F(3, 48) = 155.1, P < 0.0001, Tukey’s post hoc analysis, P < 0.01) (j). n = 13 cells from seven mice. Data are presented as the mean ± SEM. Source data are provided as a Source Data file.

