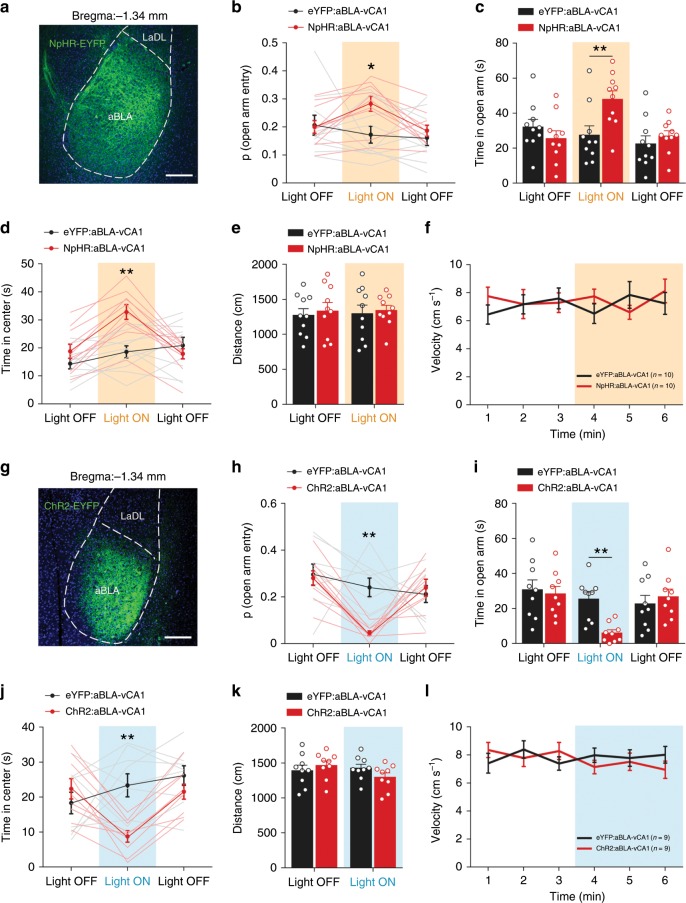
Fig. 3. aBLA–vCA1 inputs promote avoidance behaviour and exert anxiogenic effects.
a, g Representative confocal images of ChR2 (a) and NpHR (g) expression in the aBLA. Scale bar, 200 μm. ChR2 (b–d) and NpHR (h–j) mice were tested in the EPM (b, c, h, i) and OFT (d, j) as described in Fig. 2. During the illumination epoch in the EPM, the probability of open-arm entry and time spent in the open arms decreased in ChR2 mice (b, c) but increased in NpHR mice (h, i) compared with eYFP mice (two-way ANOVA group × epoch interaction; probability of open-arm entry [ChR2] F(2, 32) = 5.477, P = 0.0090, Bonferroni post hoc analysis, **P < 0.01; [NpHR] F(2, 36) = 3.409, P = 0.0441, Bonferroni post hoc analysis, *P < 0.05; time spent in open arms [ChR2] F(2, 32) = 4.449, P = 0.0197, Bonferroni post hoc analysis,**P < 0.01; [NpHR] F(2, 36) = 6.815, P = 0.0031, Bonferroni post hoc analysis, **P < 0.01. During the illumination epoch in the OFT, the time spent in the centre decreased in ChR2 mice (d) but increased in NpHR mice (j) (two-way ANOVA group × epoch interaction, ChR2: F(2, 32) = 9.428, P = 0.0006, Bonferroni post hoc analysis, **P < 0.01; NpHR: F(2, 36) = 14.27, P < 0.0001, Bonferroni post hoc analysis, **P < 0.01). No effects of light stimulation on distance travelled (e, k) or velocity (f, l) were detected. Two-way ANOVA group × epoch interaction, travelled distance [ChR2] F(1, 16) = 2.312, P = 0.1479; [NpHR] F(1, 18) = 0.007063, P = 0.9340; velocity [ChR2] F(5, 80) = 1.13, P = 0.3514; [NpHR] F(5, 90) = 1.188, P = 0.3212. n = 10 mice (b–f) or 9 mice (h–l) per group. Data are presented as the mean ± SEM. Source data are provided as a Source Data file.

