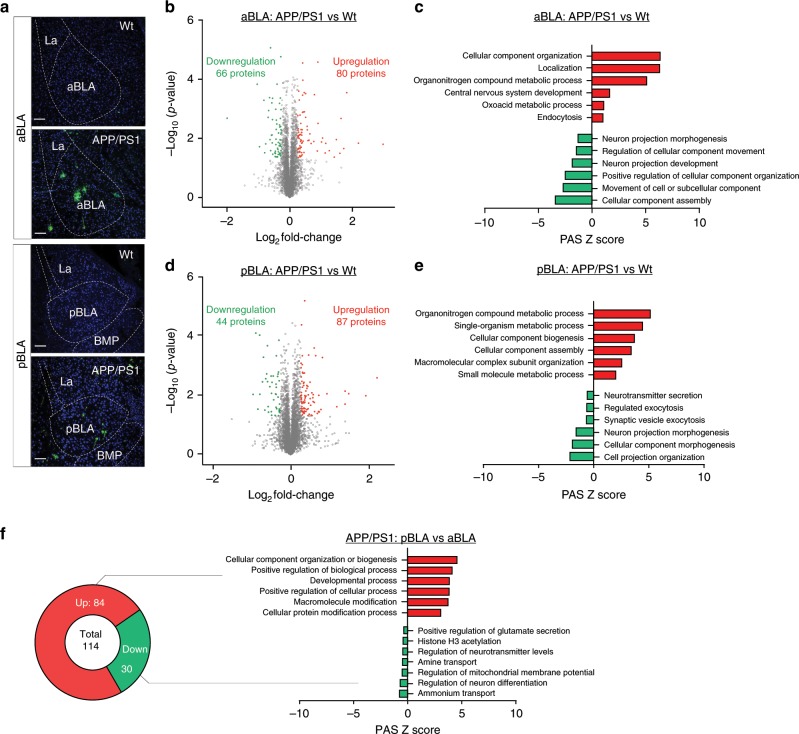
Fig. 5. Proteomics reveals distinct molecular changes in the aBLA versus pBLA of APP/PS1 mice.
a Representative images of Aβ pathology in the aBLA and pBLA by 6E10 staining. Scale bar, 100 μm. Volcano plot showing protein changes in the aBLA (b) and pBLA (d) in 6-month-old APP/PS1 versus wild-type (Wt) mice. Red and green dots represent proteins whose abundance is significantly increased or decreased. GO enrichment analysis of up- and downregulated GO categories in the aBLA (c) and pBLA (e) of APP/PS1 mice versus Wt mice, or GO categories differentially regulated in pBLA versus aBLA of APP/PS1 mice (f). n = 3 mice per group.

