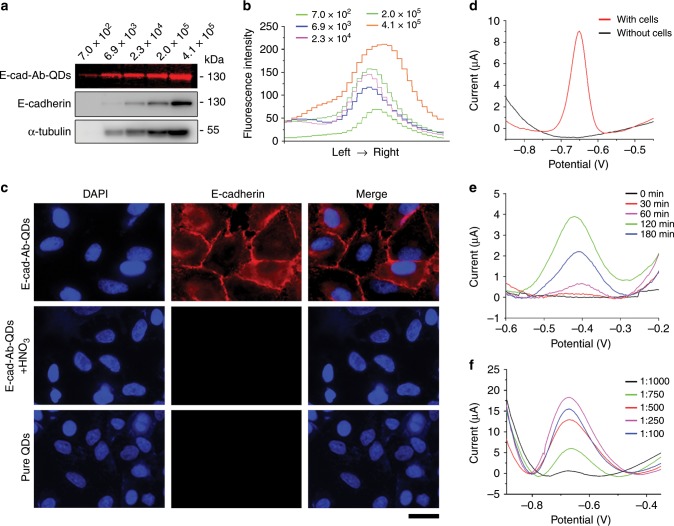
Fig. 3. Specificity and sensitivity of the prepared probe.
a Immunoblotting of E-cadherin with the E-cad-Ab-QD probe and standard E-cadherin antibodies using different amount of A549 cells. b Fluorescence intensity curves of E-cadherin from different amount of cells. c Immunofluorescence microscopy of A549 cells stained with the E-cad-Ab-QD probe, the E-cad-Ab-QD probe with HNO3 solution, and pure QDs. Scale bar, 25 μm. d Response currents of the electrochemical biosensor measured with or without A549 cells by DPV. e Optimization of the incubation time for the E-cad-QD probe. f Optimization of the E-cad-Ab-QD probe concentration for detecting E-cadherin. Source data are provided as a Source Data file.

