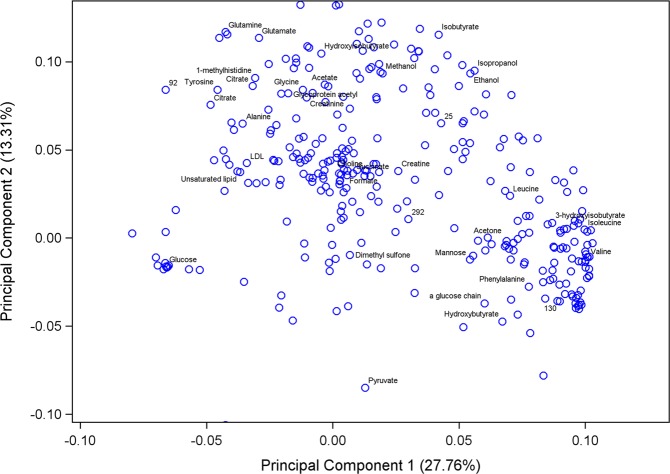
Figure 3.
Principal Component Analysis loading plot showing the correlation between metabolites and principal components 1 and 2. All 34 identified metabolites as well as four unknown components that were selected in the classification and regression tree analysis are displayed in the plot. Citrate appears twice as the CART analysis selected two different citrate peaks as components of importance in differentiating BRD and non-BRD animals for two different diagnosis methods.

