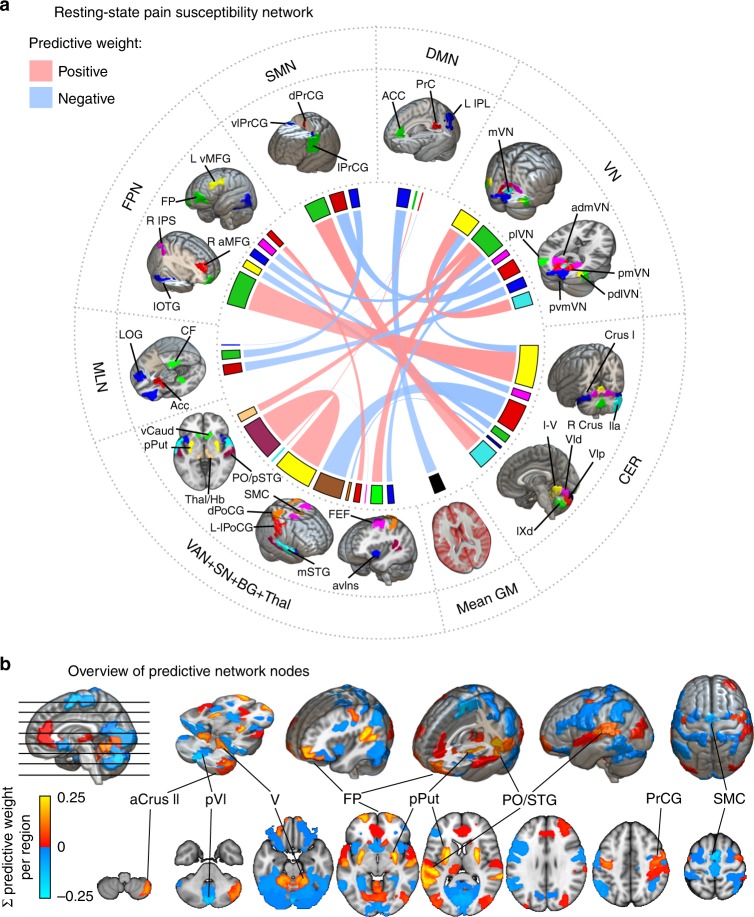
Fig. 3. The resting-state pain sensitivity network signature.
a The predictive network of the RPN-signature. Widths of ribbons are proportional to the predictive weights of the functional connections. Network-nodes are color-coded and displayed in 3D-views. Note that, the utilised brain atlas is based on an entirely data-driven functional parcellation and is, therefore, not fully bilateral. Where laterality (L: left, R: right) is not explicitly specified, the atlas did not distinguish the region from its contralateral homolog. b Regional predictive strength map of the RPN-signature. Colour-bar depicts region-wise predictive strength (sum of the weights of all connections for the region, multiplied by the study-specific regional probability map). Regions with an absolute predictive strength greater than 0.1 are annotated.

