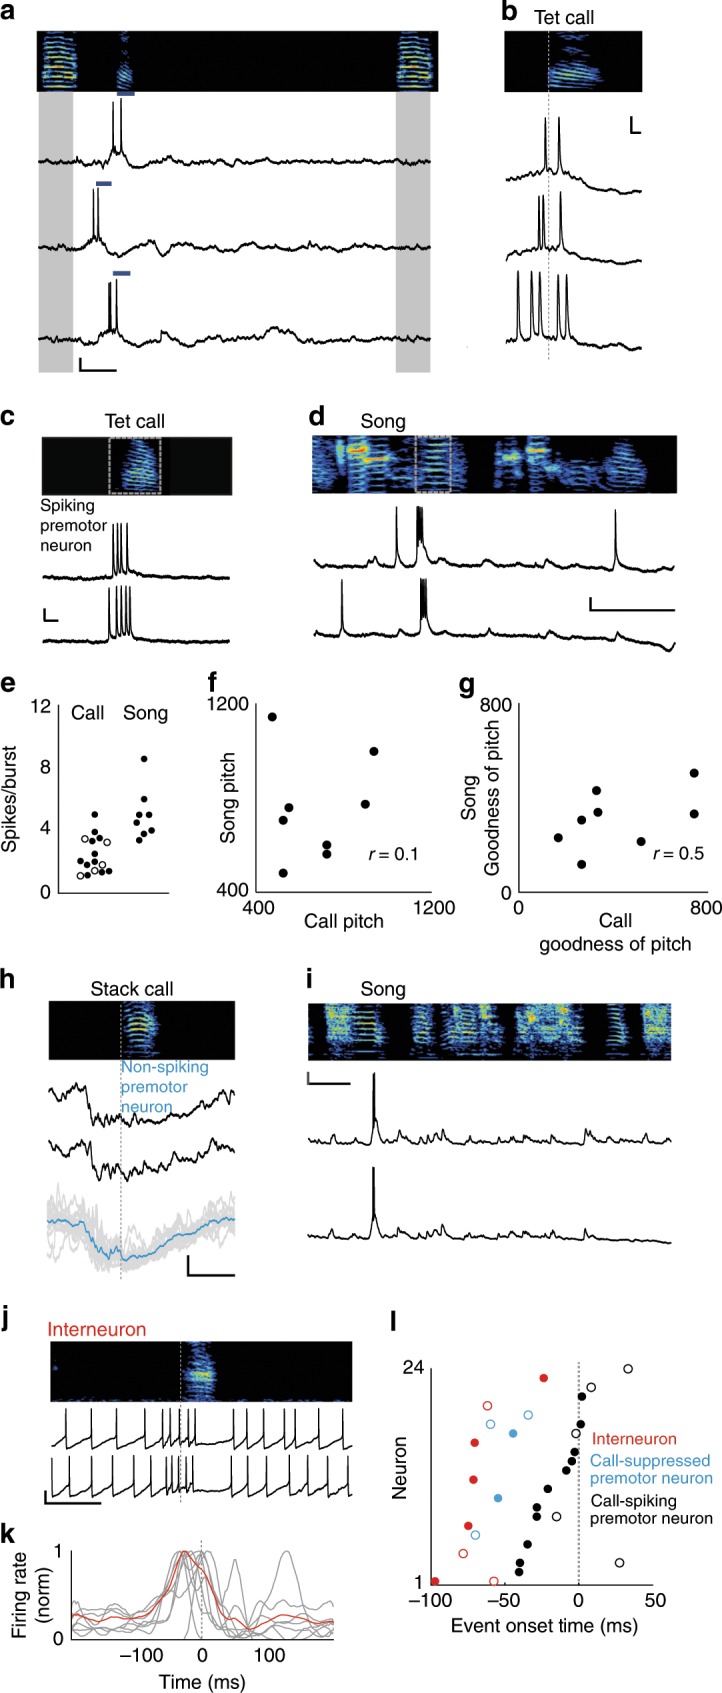
Fig. 3. Activity of HVC neurons preceding call production.

a Spectrogram (top) and intracellular recordings of an HVC premotor neuron during call responses (blue bars) to call playbacks (gray). x, y scale bars: 100 ms, 10 mV. b Intracellular activity as in (a), aligned to tet call onsets (gray dotted line). x, y scale bars: 10 ms, 10 mV. c, d Bursting activity from a premotor neuron for tet calls (c) and song (d). x, y scale bars for (c): 10 ms, 10 mV. x, y scale bars for (d): 100 ms, 10 mV e Mean spikes per burst for premotor neurons during calls and song (n = 14 neurons (calls), n = 6 neurons (song), 2.4 ± 1.2 spikes per burst (calls), 5.0 ± 1.7 spikes per burst (songs), Wilcoxon rank-sum test, p < 0.001, Note: two neurons elicited two bursts during singing). Tet calls: solid circles, stack calls: open circles. f, g Correlation of acoustic features occurring after premotor neuron activity (gray boxes in (c, d)), (Spearman correlation, pitch: p = 0.840, goodness of pitch: p = 0.197, n = 6 neurons). h Hyperpolarization of a premotor neuron prior to calls (black). Bottom: Overlay of 13 renditions from example neuron in gray. Mean membrane potential in blue. x, y scale bars: 100 ms, 5 mV. i Same premotor neuron as in (h) recorded during two renditions of song. x, y scale bars: 100 ms, 10 mV. j Example recording of interneuron during calling. k Normalized firing rates for 7 interneurons relative to call onsets (average indicate in red). x, y scale bars: 100 ms, 10 mV. l Red circles: Onset of increased activity for n = 7 interneurons in (k), onsets of hyperpolarization for n = 5 premotor neurons (blue circles), and onsets of bursts for n = 14 premotor neurons (black circles) relative to start of call (gray dotted line). Open circles: stack calls, closed circles: tet calls (mean premotor neuron burst onset = −10 ± 22 ms, mean hyperpolarization onset = −52 ± 14 ms, Wilcoxon rank-sum test, p = 0.003, mean interneuron firing increase onset = −56 ± 31 ms, Kruskal–Wallis test, p < 0.0001). Source data is available as a Source Data file.
