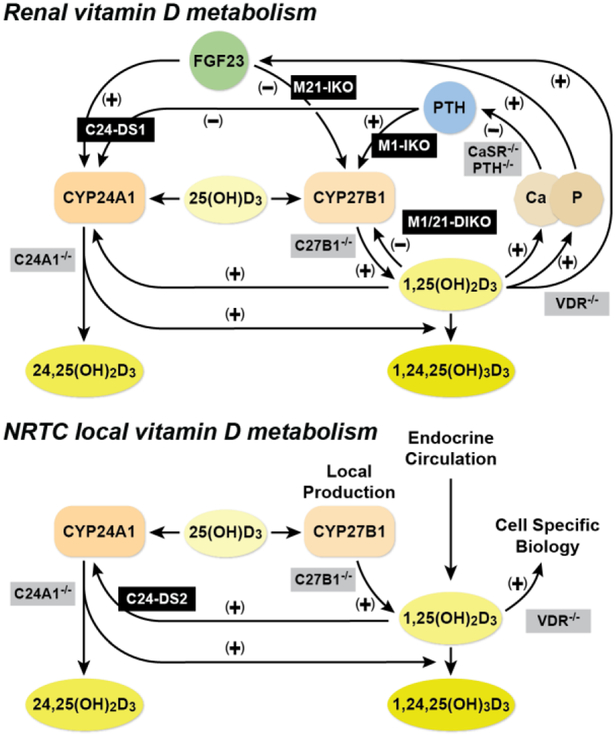
Figure 3:
Vitamin D metabolism in the kidney and non-renal tissues. Schematic diagram for the regulation of vitamin D metabolism and serum calcium and phosphate homeostasis in the kidney (top) and non-renal target cells (NRTCs, bottom). Our genetic models (black) and previously existing models (grey) are overlaid on or near the pathways they disrupt. This figure first appeared in Meyer, Lee, et. al. (2019) [19].

