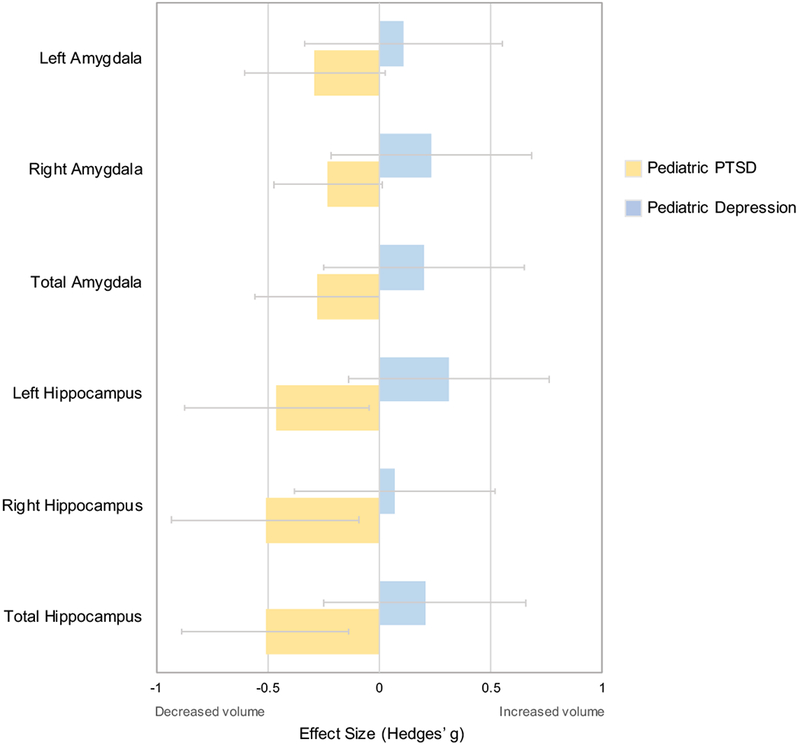
Figure 5.

Comparison analysis of hippocampal and amygdala volumes between pediatric PTSD and pediatric depression.
The comparison study is one in which pediatric depression (n=30) was compared to a pediatric group without depression (n=56) at the second timepoint in a longitudinal study (Whittle et al., 2016). Positive Hedges’ g values indicate increased structural volume in pediatric participants with the condition indicated in the legend. Negative Hedges’ g values indicate smaller structural volumes in participants with the condition indicated in the legend. Error bars represent width of 95% confidence interval.
