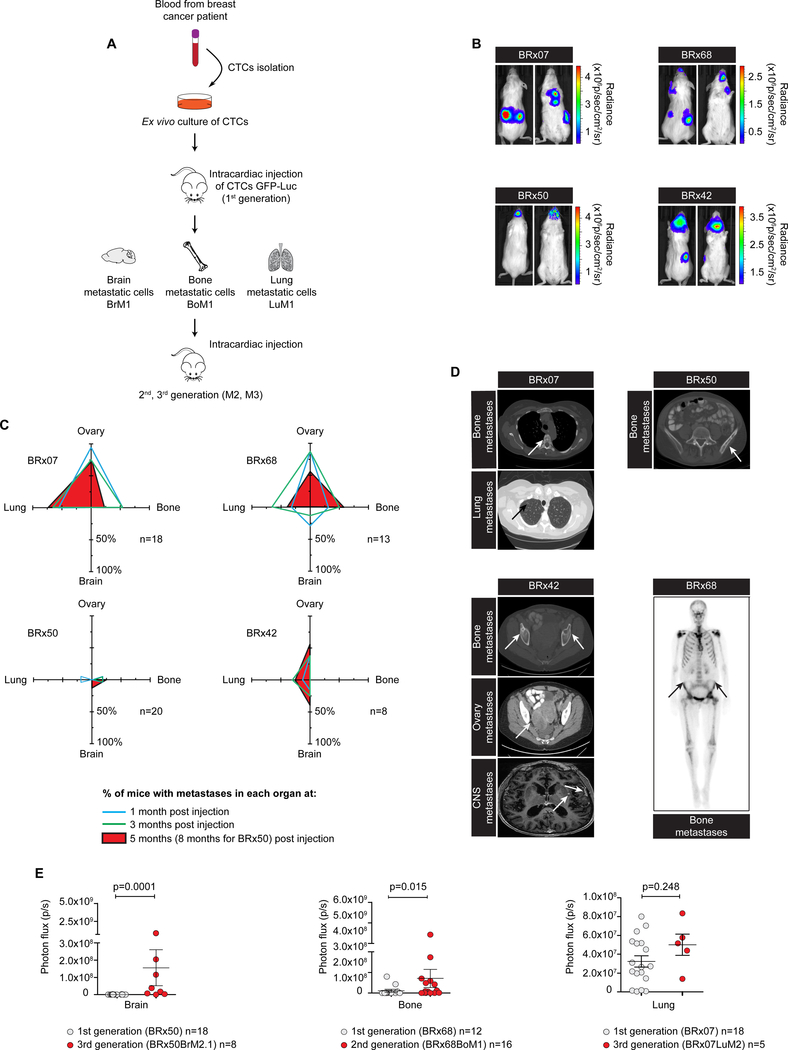
Figure 1. Patient-derived CTC lines recapitulate human metastases in mice.
A, Schematic showing ex vivo expansion of CTCs and in vivo inoculating and passaging of CTC lines. B, Representative bioluminescence imaging (BLI) data of mice injected with CTC lines at 5 months (BRx07, BRx68 and BRx42) or 8 months (BRx50) after inoculation. Each image shows the back and front of the same mouse. C, Plots summarizing the percentages of mice exhibiting ovary, bone, brain and lung metastases at different time point after CTC inoculation, based on in vivo and ex vivo organ BLI data. n = number of mice. D, Scan images of metastatic lesions in patients from whom CTC lines were generated. Arrows show tumor locations. E, Quantification of BLI intensity in brain, bone and lung at 5 months after intracardiac inoculation of CTC or CTC-derived metastatic variants in mice. Circles represent individual mouse, horizontal lines represent the mean ± s.e.m. n = number of mice. P values were obtained with Wilcoxon rank sum test.

