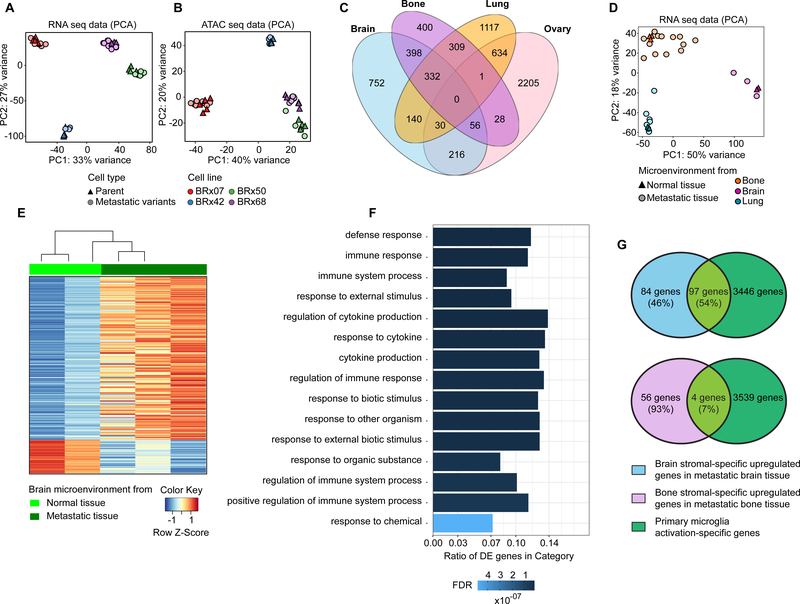
Figure 2. Global analysis of gene expression and chromatin accessibility in CTC-derived metastases and tumor microenvironment.
Principal component analysis (PCA) of RNA-seq (A) and ATAC-seq (B) data in tumor cells. CTC lines are color-coded, and cell types are shape-coded. C, Venn diagram depicting differentially expressed genes in the CTC-derived metastatic tumor cells between 4 different metastatic sites. D, PCA of RNA-seq data in stromal cells from bone, brain and lung. Organs are color-coded, and conditions are shape-coded. E, Heatmap depicting stromal-specific gene expression in normal brain tissue and metastatic brain tissue (differentially expressed genes FDR ≤0.05). F, Top enriched gene ontology (GO) pathways of upregulated genes in metastatic brain stromal cells after tumor formation relative to normal brain stromal cells. FDR value is color-coded and the ratio of differentially expressed (DE) genes in each category is represented in the bar graph. G, Venn diagram depicting differentially expressed gene observed in each comparison. Primary microglia activation-specific genes were derived from Das et al (12).

