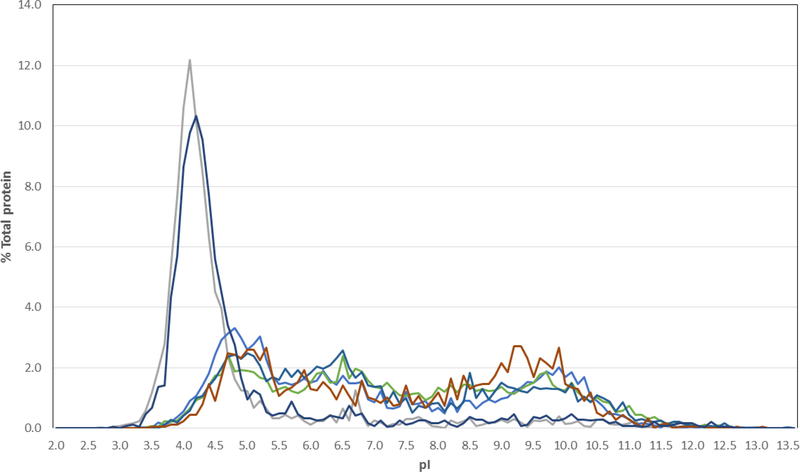
Fig. 1. Isoelectric point distribution of haloarchaeal and non-haloarchaeal proteins.
Percent of total proteins with pI values are plotted versus pI for the Haloarchaea, Halobacterium sp. NRC-1 (gray) and Halorubrum lacusprofundi (dark blue), and non-halophiles, E. coli (medium blue), Bacillus subtilis (light blue), Methanocaldococcus jannaschii (red) and Schizosaccharomyces pombe (green) (DasSarma and DasSarma 2015;Kennedy, et al. 2001).

