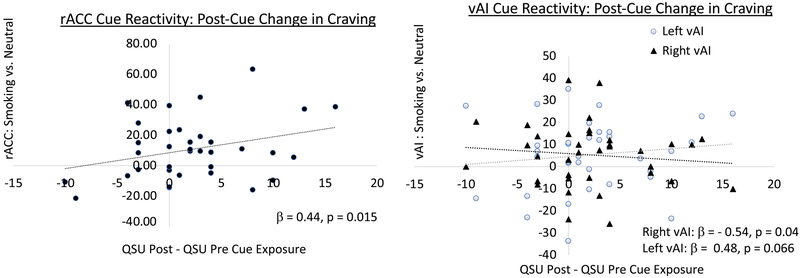
Figure 2: Association between cue-induced change in craving and brain reactivity to smoking cues.
All 6 ROIs were included in a single model that was significant (F (7, 28) = 2.82, p = 0.024, R =0.64, adjusted R2 = 0.27). While rACC reactivity to smoking cues significantly predicted the subsequent rise in craving (left plot, black circles, standardized β = 0.44, p = 0.015), the right vAI showed the opposite effect (right plot, black triangles, standardized β = −0.54, p = 0.04) and there was a trend effect in the left vAI, which was similar to the rACC findings (right plot gray circles, standardized β = 0.48, p = 0.066).

