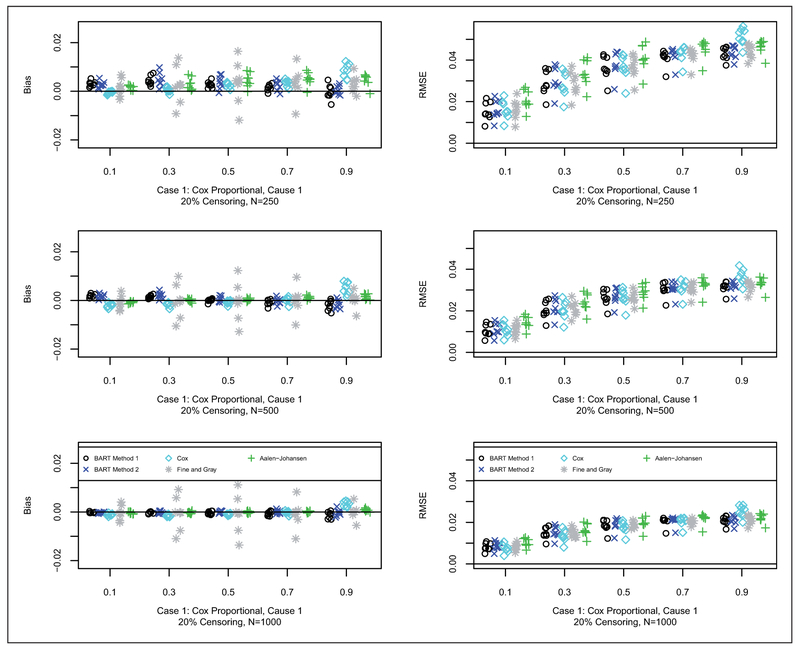
Figure 2.
Bias (left) and RMSE (right) for case 1 with 20% censoring: N = 250 (first row), N = 500 (second row), and N = 1000 (third row). Each simulated data set was analyzed with both BART competing risks models, Cox proportional cause-specific hazards models, Fine and Gray proportional subdistribution hazards model, and the Aalen-Johansen nonparametric estimator. For brevity, we only consider cause 1 which is generally the cause of interest. For each scenario, we examined the prediction performance in terms of bias and Root Mean Square Error (RMSE), at the following quantiles of the cdf: 10%, 30%, 50%, 70% and 90%. Results are plotted as points against quantile for each case and sample combination; note that there are 16 points (eight shown here and eight in the supplement) for each case and sample combination: 2 groups as targets for prediction, x = 0, 1; 4 parameter configurations, a = 1, 2, 3, 4 (shown in Table 2); and 2 censoring rates, 20% (shown here) and 50% (in the supplement), b = 0.2, 0.5. The bias and RMSE metrics were assessed at the five chosen quantiles, Q, e.g. where tQ is such that Q = F1,ab(tQ, x) + F2,ab(tQ, x); N is the sample size; and h = 1, … , H are the simulated data sets.

