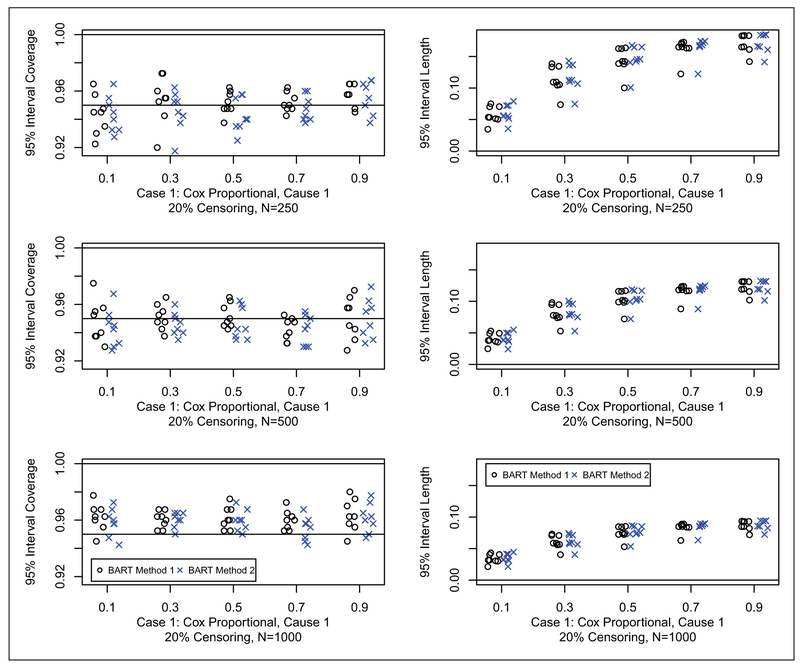
Figure 5.
Coverage (left) and width (right) of 95% posterior intervals for case 1 with 20% censoring: N = 250 (first row), N = 500 (second row), and N = 1000 (third row). Each simulated data set was analyzed with both BART competing risks models. For brevity, we only consider cause 1 which is generally the cause of interest. For each scenario, we compare the 95% interval coverage probability and 95% interval length for the two BART methods. Results are plotted as points against quantile for each case and sample combination; note that there are 16 points (eight shown here and eight in the supplement) for each case and sample combination: two groups as targets for prediction, x = 0, 1; four parameter configurations, a = 1, 2, 3, 4 (shown in Table 2); and two censoring rates, 20% (shown here) and 50% (in the supplement), b = 0.2, 0.5. The 95% interval coverage and length was assessed at the five chosen quantiles, e.g. where tQ is such that Q = F1,ab(tQ, x) + F2,ab(tQ, x); N is the sample size; and h = 1, … , H are the simulated data sets.

