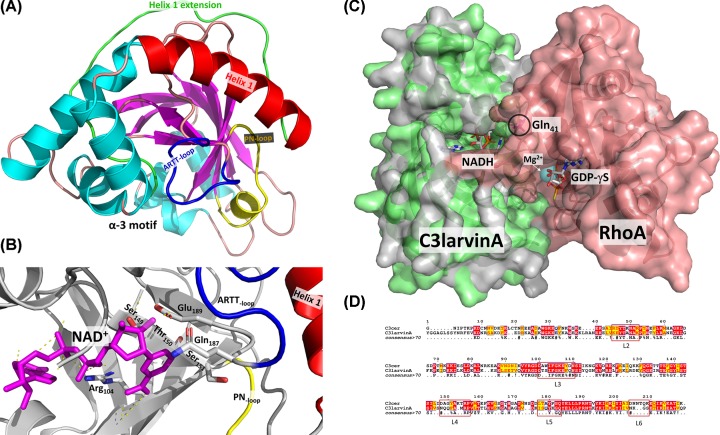
Figure 2. C3larvinA structures.
(A) C3larvinA homology model structure based on Plx2A from P. larvae (PDB: 5URP) is shown as a ribbon diagram. The NAD+ substrate was modeled within the active site of C3larvinA as described in the ‘Experimental procedures’ section. Secondary structural elements such as α-helices are colored in cyan and β strands are shown in magenta. The α-3 motif, helix 1 (red), the helix 1 N-terminal extension (green), and the ARTT- (dark blue) and PN-loops (yellow) are also labeled. (B) C3larvinA active-site catalytic elements are shown. Catalytic residues Arg104, Gln187 and Glu189 are shown in stick format with standard element colors. The STS motif (S149-T150-S151) is also shown in stick format, along with the PN-loop (yellow), ARTT-loop (dark blue) and helix 1 (red). The NAD+ substrate is bound in the active site and is shown in magenta with important H-bonds indicated by yellow dashed lines. (C) C3larvinA-NADH-RhoA homology model built on the C3cer-NADH-RhoA crystal structure (PDB:4XGS) is shown in surface rendering. C3larvinA is shown in light green and RhoA in salmon color. The NADH inhibitor is bound in the active site and is shown in stick format colored with standard element colors, Gln41 in RhoA is circled and is shown in stick format colored magenta; Mg2+ is shown as a cyan sphere and GDP-γS is shown in stick format with standard element colors. (D) Sequence alignment of C3cer and C3larvinA C3-like toxins using the T-Coffee web server to align the sequences and ESPript to generate the figure [70]. Identical residues between both C3-like toxins are printed in red text and highlighted in yellow; the conserved loop regions that form the critical interactions with the RhoA substrate based on the C3cer-NADH-RhoA crystal complex (PDB:4XGS) are bounded by red rectangles [40].

