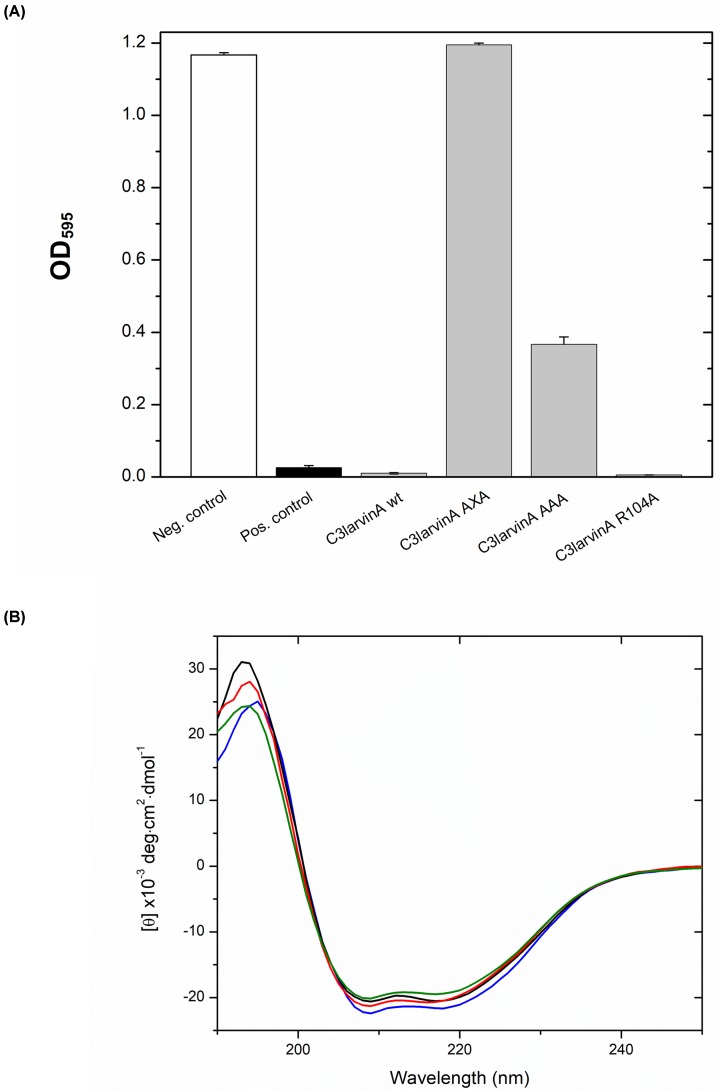
Figure 3. C3larvinA inhibition of yeast growth and CD spectra.
(A) Inhibition of yeast growth by C3larvinA and selected catalytic variants. All growth is compared with that of yeast expressing a positive control toxin, P. aeruginosa exotoxin A catalytic domain. The negative control contained the empty plasmid, pRS415 CUP1. The C3larvinA variants are shown as C3larvinA AXA (Q187A-X-E189A), C3larvinA AAA (S149A-T150A-S151A) and C3larvinA R104A. (B) CD spectra of C3larvinA WT (red), Q187A-X-E189A (green), S149A-T150A-S151A (black) and R105A (blue) were collected in aqueous solution (25°C) containing 250 mM NaF and 10 mM Tris, pH 7.5 buffer. The concentration of the proteins was at 0.16 mg/ml and each protein CD consensus spectrum was obtained by scanning from 250 to 190 nm and is the average of nine independent spectra.

