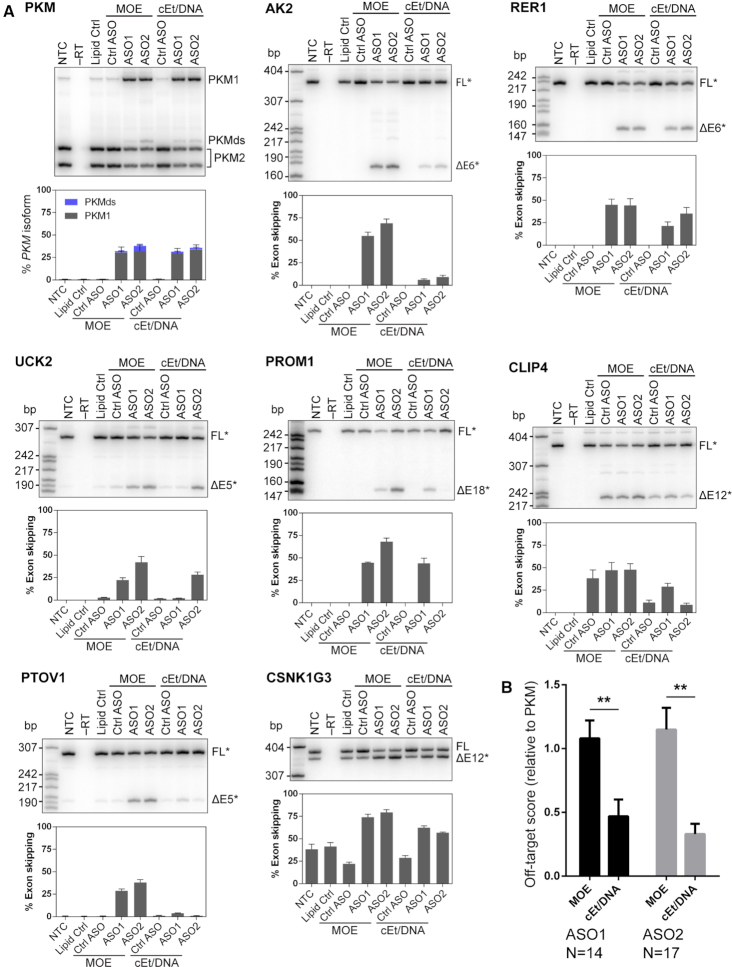
Figure 2.
Validation of predicted off-targets by RT-PCR. (A) Representative autoradiographs and quantification of splice changes of exons in transcripts to which ASOs are predicted to bind. Bar charts represent mean ± SE; N = 3; radiolabeled MspI digest of pBR322 served as size markers. PKMds (double skipping) is an aberrant splice product that lacks both exons 9 and 10. The identities of PCR fragments labeled with an asterisk (*) were confirmed by Sanger sequencing. (B) Quantification of the fold-difference of off-target effects, relative to PKM on-target effects, normalized to the Lipofectamine control (OT score). An OT-score <1 indicates that the off-target effect is smaller than the on-target effect; values >1 indicate off-target effects larger than on-target effects. The OT-score takes variable on-target activity into consideration, and thus it can be used to directly compare the off-target activity of different ASOs. N = the number of validated off-targets for each ASO (effect > 10%); ** P < 0.01.

