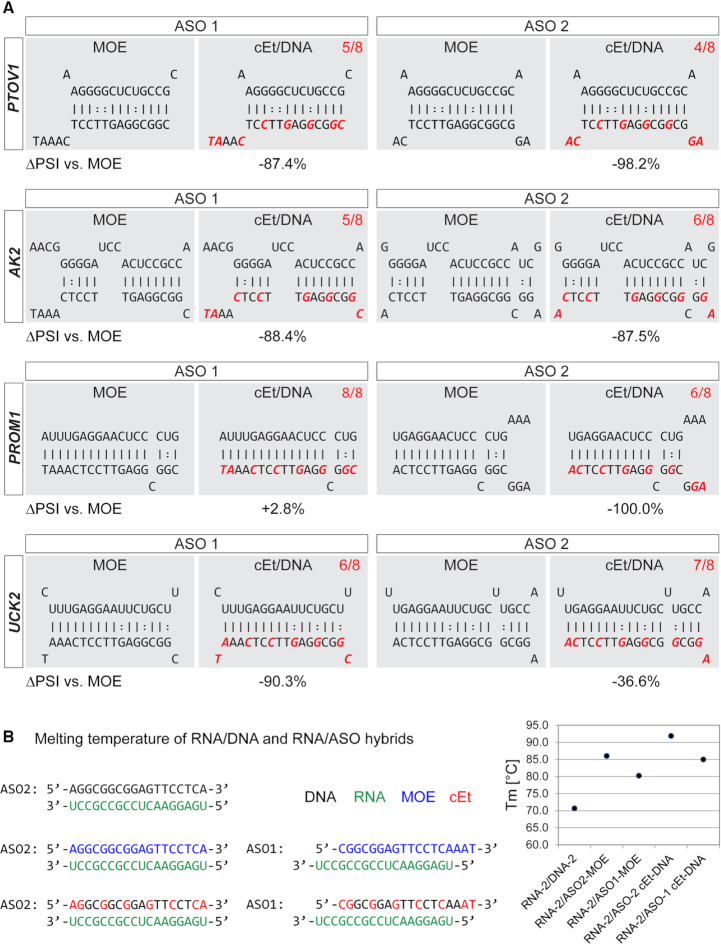
Figure 3.
Structures of individual ASO-binding sites. (A) Structures show the target sequence at the top (5'-3') and the ASO sequence at the bottom (3'-5'), as predicted (for RNA:RNA duplexes) by RNAhybrid. cEt-modified bases are highlighted in red, and the number of paired cEt bases is shown at the top right of each field. The numbers below each structure indicate the splicing change relative to the MOE-modified ASO of the same sequence. (B) Melting temperatures of RNA/DNA and RNA/ASO duplexes determined by high-resolution melting analysis. RNA (green), DNA (black), MOE (blue), cEt (red). Data points represent mean ± SE; N = 6.

