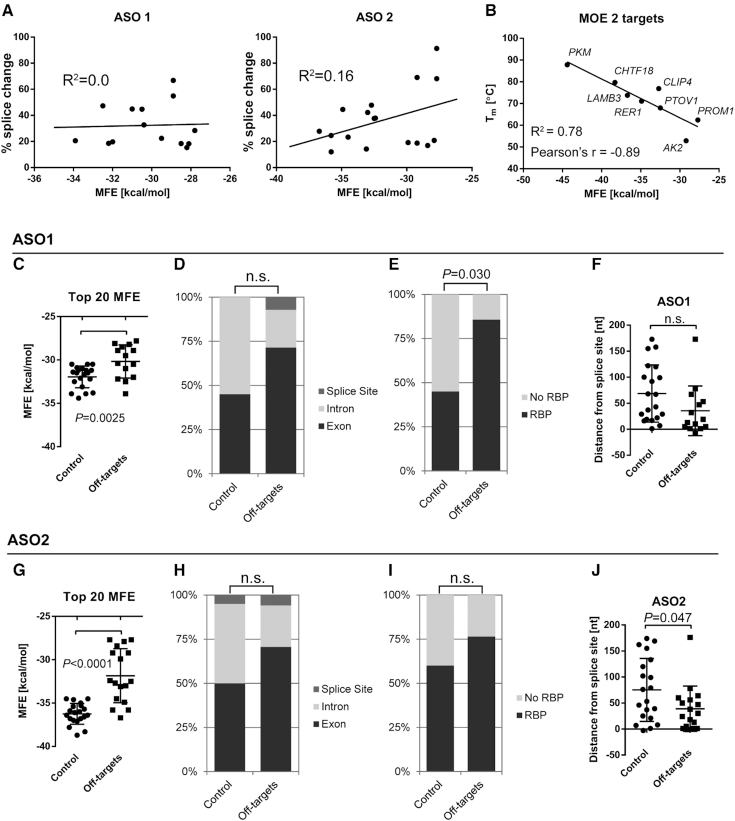
Figure 4.
Characterization of ASO-binding sites. (A) The splicing change for each of the validated off-targets does not correlate with the binding energy (MFE) (ASO1 R2 = 0.0) or is negatively correlated, with weaker interactions eliciting stronger splicing changes (ASO2 R2 = 0.16). (B) The empirically measured Tm of ASO2 and RNA templates corresponding to off-target binding sites correlates well with the predicted MFE (R2 = 0.88, N = 6). Data points show mean ± SEM Tm from 6 measurements. (C, G) Comparison of ASO-binding sites on validated off-targets (splicing change > 10%) with a control group, comprising the top 20 predicted binding sites based on MFE that did not result in a splice change. Both ASO1 and ASO2 are predicted to bind significantly more strongly to target sites in the control group, compared to sites on validated off-targets (ASO1 −30.17 kcal/mol and -31.95 kcal/mol, respectively; ASO2 −31.85 kcal/mol and −36.25 kcal/mol, respectively) Each data point indicates a unique ASO-binding site. (D, H) The relative distribution of ASO-binding sites (exon, intron, or splice site) is not statistically different between the off-target and control groups for ASO1 and ASO2. (E, I) Graph showing the proportion of ASO-binding sites with at least one RBP motif, as determined by RBPmap. (F, J) Chart indicating the distance of each ASO-binding site to the nearest splice site. Negative values indicate binding sites that span exon/intron junctions. n.s., not significant; P < 0.0056 (Bonferroni critical value) was considered to be statistically significant.

