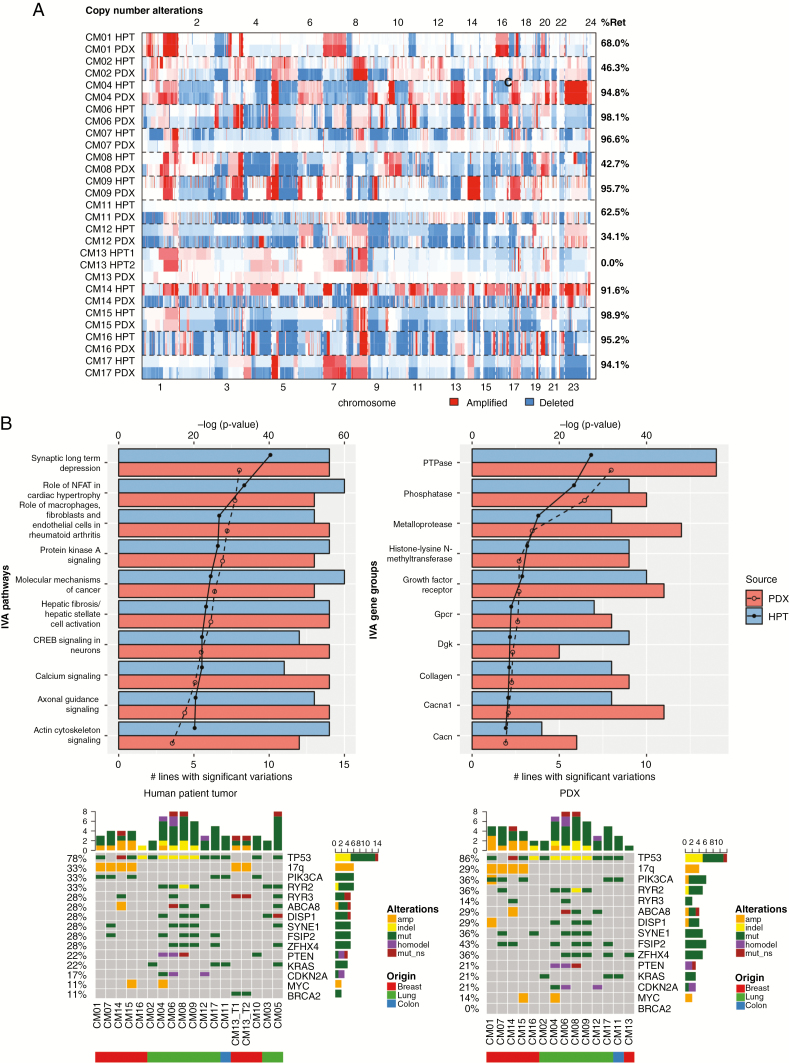
Fig. 2.
Comparison of genomic landscape between PDXs and their corresponding human patient tumors (HPTs). (A) Heatmap displaying identified in HPTs and the F0 generation of PDXs. The percentage of retained (%Ret) copy number alterations was high for most PDX–tumor pairs. (B) IVA analysis from PDXs and HPTs displaying the most significant pathways (left) and gene complexes (right) in HPTs and PDXs. The lines on the graph demarcate P-value in log scale and the bars denote the number of models with significant mutations in pathways or gene complexes. (C) Oncoprint map of common driver mutations and most frequent mutations identified in HPTs (top) and their corresponding status in PDXs (bottom).

