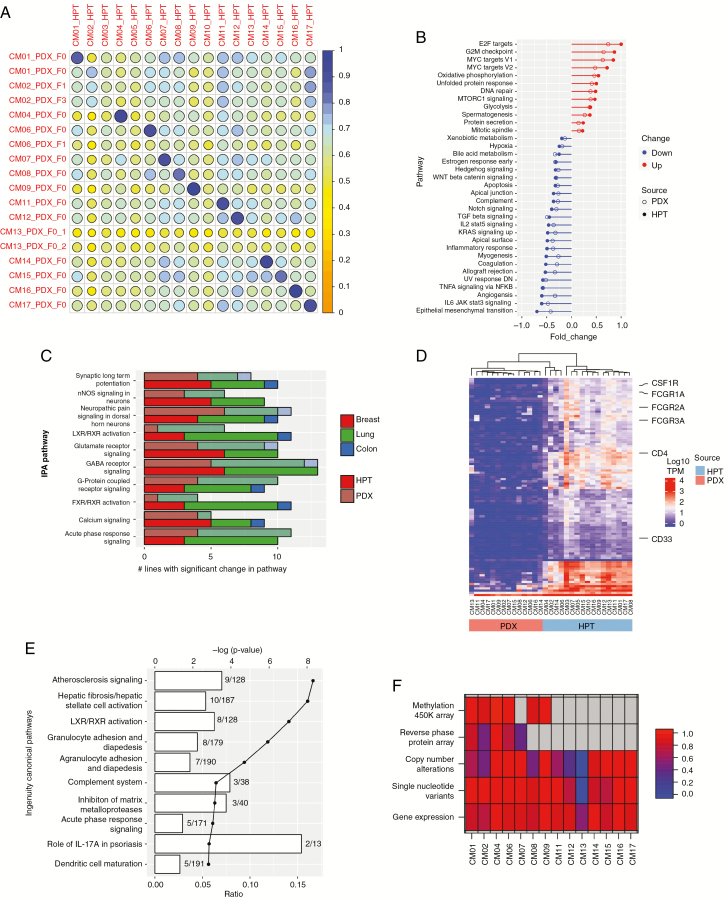
Fig. 3.
Molecular landscape of PDXs and their corresponding human patient tumors (HPTs). (A) Pearson correlation matrix of RNA-seq data between PDXs and HPTs. Two independent PDX tumors of CM13 were sequenced to confirm the low correlation with their parent tumor. GSEA (B) and IPA (C) enriched pathways were similar in PDXs and HPTs. The numbers of PDX tumors and HPTs with statistically significant changes in the most highly differentially expressed IPA pathways are shown in (C). (D) Unsupervised hierarchical clustering of the top 100 differentially expressed genes between PDXs and HPTs. (E) Differentially expressed genes identified in (D) were then analyzed by IPA. The lines on the graph demarcate P-value in log scale and the bars denote the number of differentially expressed genes identified in each pathway. (F) Multi-omic correlation matrix. Each cell represents the degree of correlation between PDX and HPT for each listed technology. Gray cells indicate data not available.

