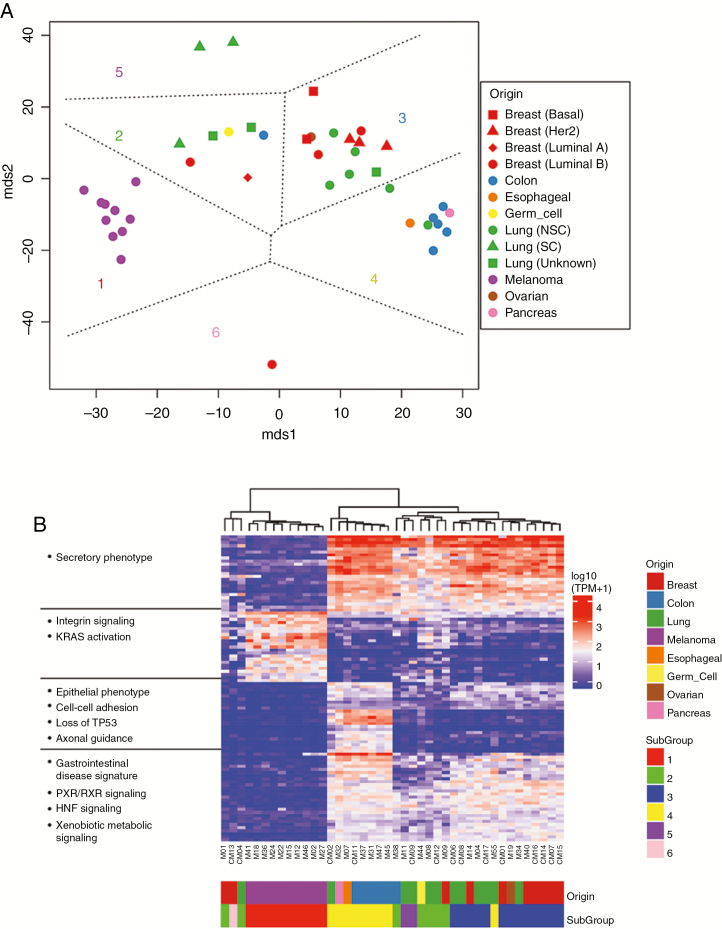
Fig. 4.
Molecular signatures of histological subtypes in CM. (A) Multidimensional scaling (MDS) and k-means classification of the gene expression data for F0 generation of 39 PDX tumors resulted in 6 distinct tumor clusters, each indicated by a subgroup number and unique color on the plot. Cluster 6 represents CM13. (B) Differential gene expression analysis between the clusters and IPA analysis of gene lists was performed. Unsupervised clustering analysis of the union of the top 100 genes across the clusters was performed and is shown along with associated enriched pathways in the heatmap.

