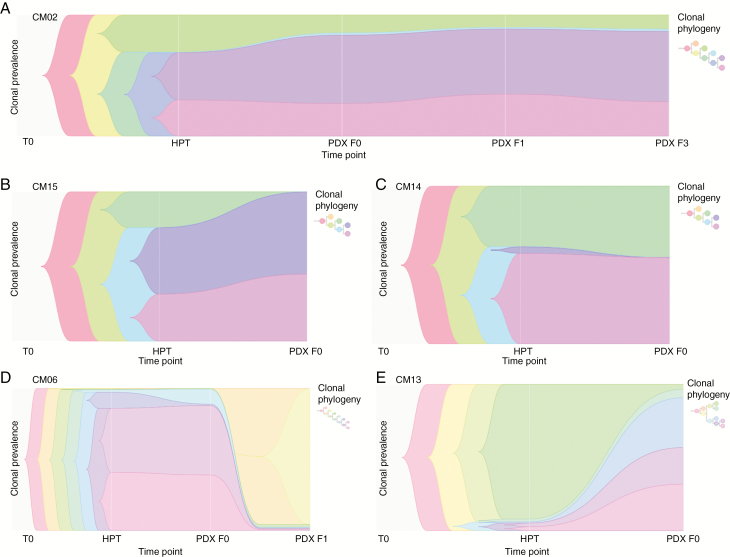
Fig. 5.
Phylogeny tracing of PDXs. (A–F) Phylogenic reconstruction from allele-specific copy number and somatic variants. Timescape plots with associated phylogenetic trees are shown for selected PDXs. Each color represents a different clone within the tumor, with the height of the bar representing the prevalence of the clone within the entire tumor, and thicker bars indicating more prevalent clones. Three PDX tumors had neutral clones, where clonal prevalence of the major clones remained relatively unchanged (A and C) or expanded (B). However, CM06-F1 (D) and CM13-F0 (E) demonstrated rapid and explosive clonal succession, respectively, where expansion of one or multiple minor clones present at low frequencies in either the patient tumor (E) or the first passage (D) was seen.

