Fig. 6.
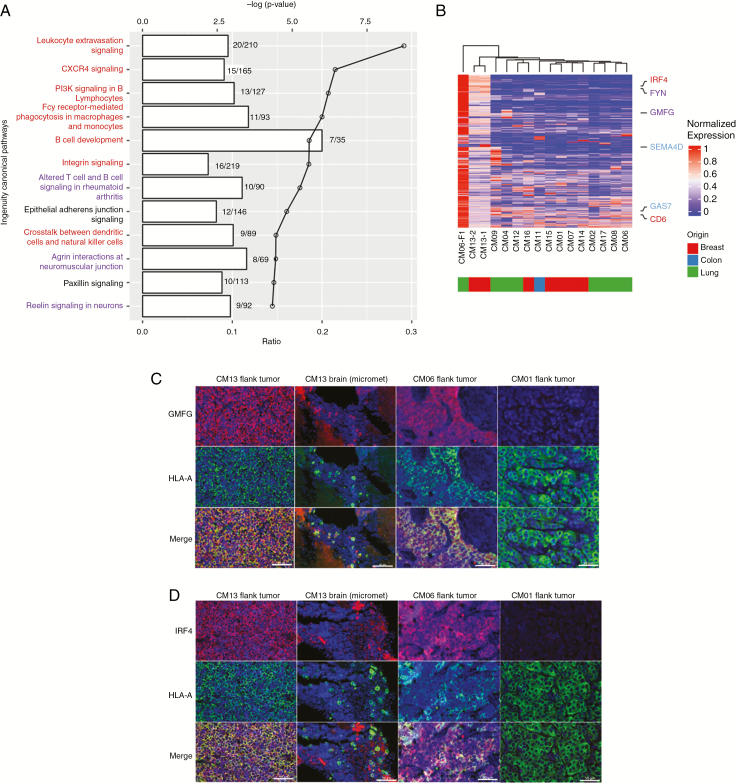
Unique gene expression features of CM with minor clone expansion (CM13-F0, CM06-F1). (A) IPA analysis of differentially expressed genes between CM13/CM06-F1 versus the other PDXs. The lines on the graph indicate the log P-value and the bar denotes the number of differentially expressed genes identified in each pathway. Immune-related (red) and neuronal-related (blue) pathways are highlighted. (B) Hierarchical clustering of the top 100 differentially upregulated genes in CM13 and CM06-F1 have distinct expression profiles compared with the other models. Selected genes related to immunity (red), neuronal signaling (blue), or both (purple) are highlighted. (C–D) Immunofluorescence staining of 2 differentially expressed genes, (C) GMFG and (D) IRF4 (red staining), in the flank tumors of CM13, CM06-F1, and CM01 (non-minor clone tumor), and brain micrometastases from flank-implanted CM13, along with human leukocyte antigen A (green staining), a human-specific marker, and counterstained with 4′,6′-diamidino-2-phenylindole (blue staining). Scale bars represent 50 μm.

