
Figure 2.
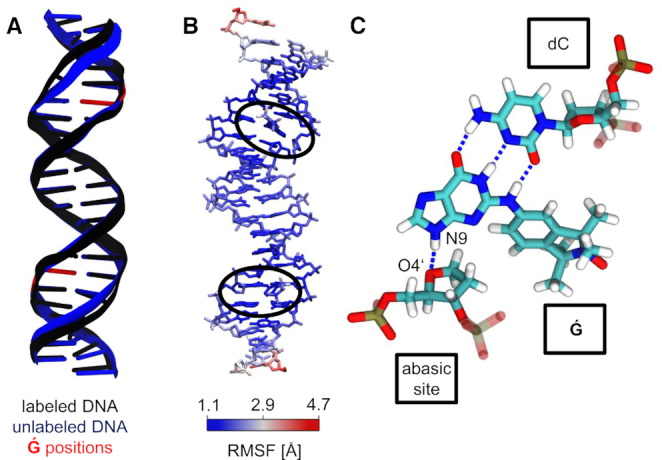
Structural influence of  labeling on dsDNA. (A) Average structures of the labeled and unlabeled dsDNA simulations. The position of the
  molecules and abasic sites are depicted in red at the unlabeled structure. (B) Atom position root mean square fluctuations of
  -labeled dsDNA, color coded on a representative MD structure. The averaged structure of the labeled dsDNA simulation was taken as the reference state.
  regions are highlighted with black ellipses. (C)
  interactions in a dsDNA. Stable hydrogen bonds between
  and the complementary dC are shown as dashed lines. An additional hydrogen bond forms between
  (N9) and the abasic site (O4′).