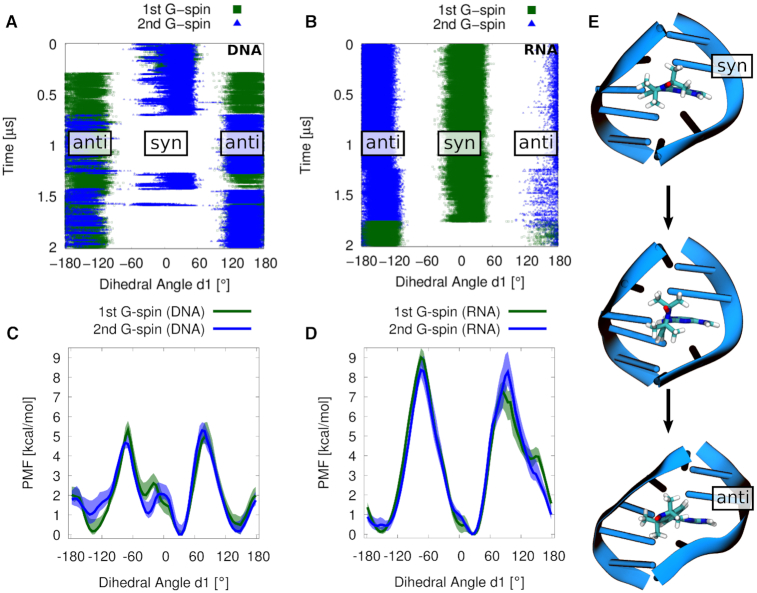
Figure 3.
(A, B) Dihedral angle d1 between the aromatic purine scaffold and the isoindoline nitroxide plane of the two  s in dsDNA and dsRNA during the MD simulations. (C, D) Potential of mean force profiles for rotations of
  inside the minor grooves of dsDNA and dsRNA. Note that the dsDNA sequence is not palindromic, unlike the dsRNA sequence, explaining the small difference between the two profiles in C. Shaded areas represent the minimum and maximum values of blocking analysis, using 10 blocks. (E) Rotation from syn to anti conformation of dihedral angle d1.
  is shown as sticks, and surrounding DNA bases are shown as cartoon.

