Figure 4.
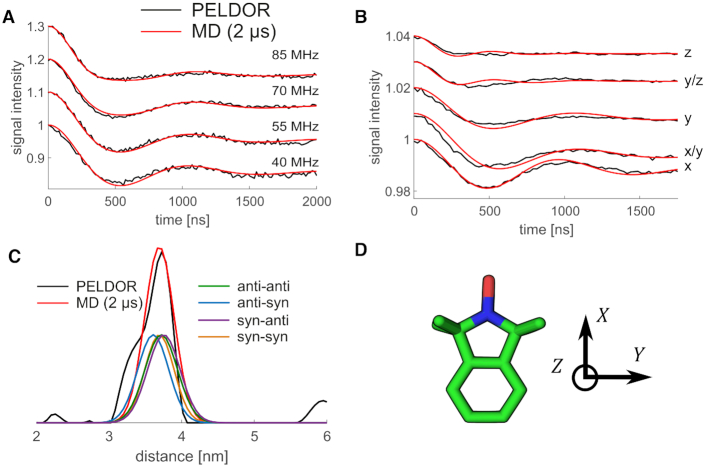
Comparison of PELDOR signals calculated directly from MD (red) to experiments (black) for DNA(1,10) without any fit. (A) PELDOR time traces measured at X-band with different offsets νn between probe and pump pulse frequency from 40 MHz (lower time trace) to 85 MHz (upper time trace). (B) PELDOR time traces measured at G-band at different field positions with a constant offset of 60 MHz. The field position corresponds to B∥gxx − B∥gzz. (C) Distance distribution from PELDOR measurements obtained by Tikhonov regularization (black) and from MD simulation (red), including the individual conformational states of the  molecule. The contribution of the different syn and anti combinations are shown as well. (D) Axis system of a nitroxide spin label.

