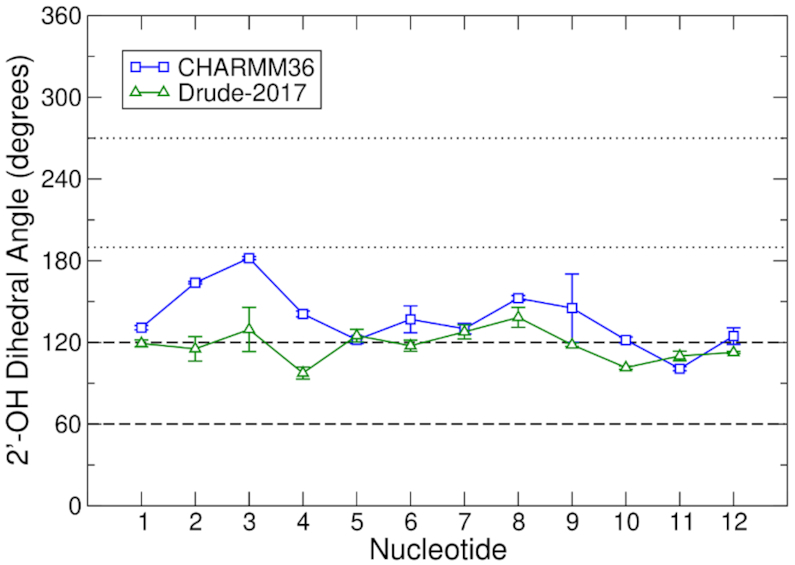
Figure 2.

2′-Hydroxyl sampling in the TERRA GQ for CHARMM36 and Drude-2017. Data from the simulations are the averages of the three pooled replicates. Error bars represent the root-mean-square fluctuation of the combined time series. Horizontal, dashed and dotted lines represent the boundaries of base (60–120°) and O3′ (190–270°) orientations of the 2′-hydroxyl group, respectively, as characterized by the C1′-C2′-O2′-H2′ dihedral.
