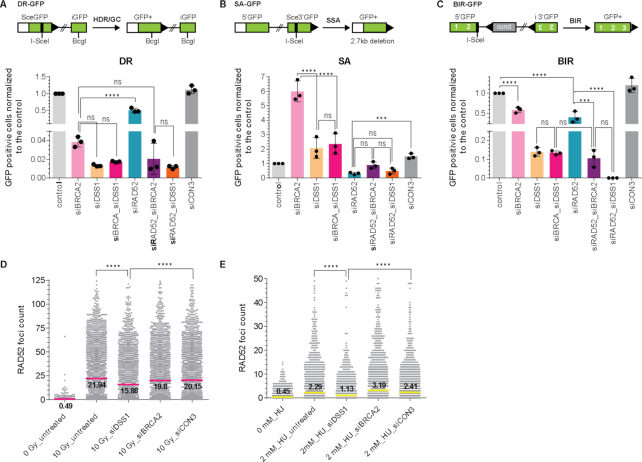
Figure 1.
DSS1 affects various DSBs repair pathways and RAD52 foci formation. (A) Schematic representation and evaluation of U2OS-DR-GFP reporter assay normalized to the control sample that corresponds to 1.7% GFP+ cells. (B) Schematic representation and evaluation of U2OS-SA-GFP reporter assay normalized to the control sample that corresponds to 2.4% GFP+ cells. (C) Schematic representation and evaluation of U2OS-BIR-GFP reporter assay normalized to the control sample that corresponds to 1.7% GFP+ cells. The mean values (±SD) of data from three independent experiments were plotted and analysed using 2way ANOVA test (P < 0.001 = ***; P < 0.0001 = ****; ns not significant). (D) Quantification of YFP-RAD52 foci at 2 h after exposure to 10 Gy X-rays. The mean values of three independent experiments are shown, P < 0.0001 = **** (E) Quantification of YFP-RAD52 foci at 4 h after treatment with 2 mM HU. The mean values of three independent experiments are shown, P < 0.0001 = ****.

