Figure 1.
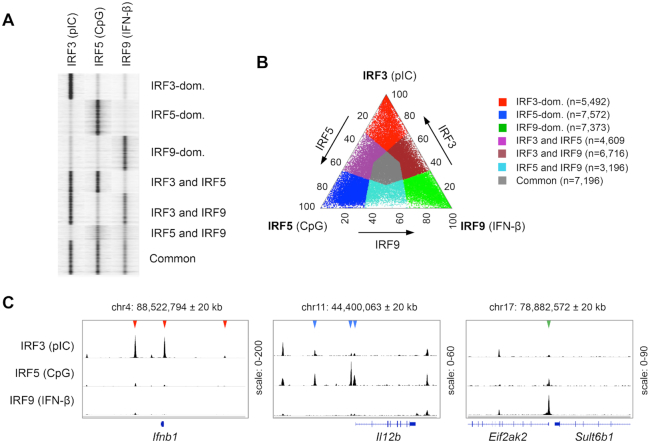
Identification of binding regions occupied differently by IRF3, IRF5 and IRF9. (A) Read distribution plot of IRF3, IRF5 and IRF9 in a 2 kb window around the summit of the IRF peaks. For ChIP-seq experiments, murine CD8+ DCs were treated for 90 min with high molecular weight polyinosinic-polycytidylic acid (pIC), class B CpG oligonucleotide (CpG) or interferon-β (IFN-β). The binding sites of IRF3, IRF5 and IRF9 were determined in DCs stimulated for 90 minutes by pIC, CpG, and IFN-β, respectively. (B) The distribution of binding regions occupied by IRF3, IRF5 and IRF9 is shown on a ternary plot. The position of each dot in the interior of the triangle was calculated based on the normalized IRF3, IRF5 and IRF9 occupancy values. The seven IRF-binding clusters were classified based on the fold induction values. The normalized occupancy values in the dominant clusters exhibit at least two-fold differences relative to the two other IRFs. (C) The genome browser view of IRF3, IRF5 and IRF9 peaks in the 40 kb window around the TSS of three representative genes. Arrowheads indicate binding regions occupied in an IRF3-dominant (red), IRF5-dominant (blue) or IRF9-dominant (green) manner.

